

(This article continues a series of articles on performance testing. The previous article was devoted to JMeter. Now it is Tsung's turn, a high-performance benchmark framework.)
The introduction section repeats the one I used in the previous article.
This article is part of a series on performance testing:
- Part 1. SAP Commerce Cloud Performance Testing Tools: Apache JMeter
- Part 2. Performance Testing Tools: Tsung
- Part 3. Performance Scripting: Writing Load Generators from Scratch
Introduction
SAP Commerce Cloud (previously known as SAP Hybris Commerce) is often used as a headless service with SAP Spartacus or third-party storefront solutions. The communication between the storefront and the platform happens via the SAP Commerce REST interface called Omni-Channel Connect (OCC). Additionally, SAP Commerce Cloud provides a set of APIs for integration (Integration APIs), content, and product management (CMS and Product Management APIs).
All these APIs are highly customizable, and even the smallest changes in configuration, data model, or Java code may result in performance degradation. Performance testing is especially important in cases where concurrency may be the source of the problem. To recognize and fix such issues in time, it is recommended to perform regular performance testing, ideally integrated into the build and deployment pipelines.
However, SAP Commerce Cloud intensively uses caching, and the test plans may not reflect the true situation if they are not designed properly. Almost all database queries are cached inside the platform so that thousands of data-fetching operations (per webservice call) don’t even reach the database. If a cache were disabled, an average single call would take minutes. Fortunately, the cache is always on, but depending on many factors, it may or may not work efficiently.
The test scenarios should be designed in such a way that they mimic real-time user actions happening in production. If your product catalog has thousands of products, and you expect a normal distribution, it is a bad idea to test the system against just a small bunch of test products. You may face the risk that Commerce Cloud demonstrates exceptional performance with this small bunch of products, but completely different results with the actual traffic.
To mimic user behavior, API sample calls can be either generated or collected from logs. For APIs, this dataset has a combination of when and what: a timestamp, a list of URLs, an HTTP method, a set of HTTP headers, and GET and POST payloads. It is often easier to simplify the model by firing calls in some pattern reflecting the actual traffic in its average approximations.
When the coronavirus outbreak happened in China, it boosted local e-commerce as many people stuck at home were forced to buy their goods online. Sales of fresh food on JD.com reportedly jumped 215% during the 10-day period and counting. The ability to serve a large number of customers is growing every year. Traffic may double in a week. How do you make sure your system is capable of serving high traffic demand? In today’s article, I’m sharing my experience with Tsung, a high-performance testing framework.
Tsung, a high-performance benchmark framework
JMeter lacks distributed load capabilities, especially when it comes to high volumes. A typical JMeter machine is often not sufficient for carrying out a large number of virtual users. This is where Tsung is an interesting alternative.
Tsung is written in Erlang, which is capable of running an extreme number (thousands) of simultaneous users from one machine because it is a concurrency-oriented programming language. In Erlang, everything is a process; these processes are strongly isolated, share no resources, and interact with each other only through messages. Erlang programs remind me of a swarm of microservices. Unlike Java, where all threads share the same address space so it is possible for one thread to trash things owned by another thread, Erlang’s units of computation are completely cut off from one another.
Such an architecture helps create flexible, reliable, and scalable solutions. For example, RabbitMQ Server, a message broker, is also implemented in Erlang. The chat messaging platform ejabberd is written in Erlang as well.
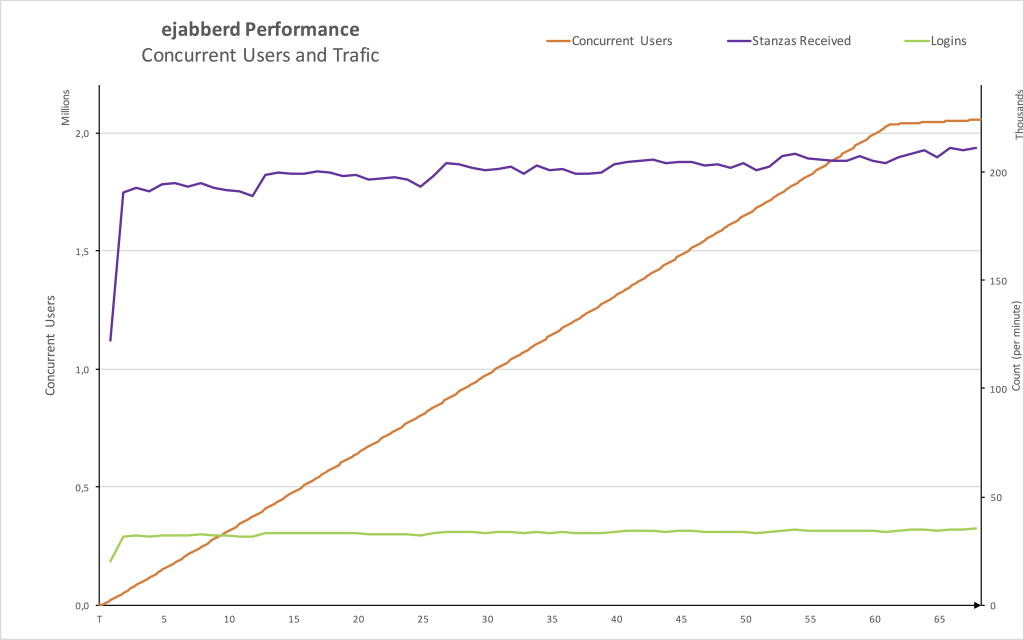
Mickaël Rémond, the lead architect of ejabberd, shared in his blog the details of the performance test of ejabberd. Both ejabberd and Tsung were running on a single Amazon EC2 instance m4.10xlarge (40 vCPU, 160 GiB). The target was to reach 2,000,000 concurrent users chatting with 18 contacts during around 1h.

Additionally, it can create a distributed load by organizing other “tsungs” in the cluster. Tsung is designed to be distributed. JMeter uses threads for this purpose, which limits its abilities.
According to the report from WIPRO Cloud Testing Practice, Tsung was able to inject up to 45,000–60,000 simultaneous users per agent machine with throughput up to 5,000 requests/second, whereas JMeter was able to simulate up to 12,000 users and 1,000 requests per second (for 4,500 users) from the high-performance node 20 ECU, 8 cores, 7Gb. In a cluster of 11 nodes (each has 8 ECU, 4 cores, 15Gb), Tsung was able to reach 0.9 million simultaneous users.
In my project, I needed to generate a list of URLs and JSON payloads to get them close to what the system will experience after go-live. In my test plan, I needed to read the POST payload from a file and send it as the body for a POST request to the REST API, parse the response, and log the response time along with a response code and webservice response body. I also needed to control the pattern of the load and visualize the results.
For example, you have 10,000 products, and you need to load test the product details API (customer-facing) and product stock update API (used by the internal systems). For both, you need to inject a product code into the URL (in the case of the product details API) or into the JSON (for the stock update).
You can also read the content of a POST or PUT request from an external file, but normally this filename is static and cannot be generated dynamically as shown above for JMeter.
GUI
Unlike JMeter, Tsung doesn’t provide a graphical user interface for test development or execution. All you have are configuration files and shell scripts:
- Tsung, a bash script for starting/stopping the Tsung controller
- Tsung-recorder, a script that records HTTP and Postgres requests and creates a draft Tsung config file from them. Normally, this config needs polishing.
- Tsung_stats.pl, a Perl script to generate HTML statistical and graphical reports. It requires gnuplot and the Perl Template library.
The configuration file requires tsung-1.0.dtd, which can be downloaded from the official website.
<?xml version="1.0"?>
<!DOCTYPE tsung SYSTEM "tsung-1.0.dtd">
<tsung loglevel="debug" version="1.0" dumptraffic="true">
...
First, you need to specify to what server(s) we are directing the load. For our sample script SAP Commerce Cloud local instance, it is https://localhost:9002, but normally it is against best practice. You shouldn’t direct load at the same host because both Tsung and the system will share the same CPU and memory resources:
<servers>
<server host="localhost" port="9002" type="ssl"/>
</servers>
A pair of arguments, loglevel="DEBUG" and dumptraffic="true", are here to see the details of requests in the log file during test development. Next, we need to specify the controller details:
<clients>
<client host="localhost" use_controller_vm="true" maxusers="10000"/>
</clients>
The use_controller_vm attribute means that you don’t want Tsung to connect to another machine and execute tests from there, and instead run them from the parent process, which is the controller’s. If you omit this attribute, Tsung will attempt to connect to the local machine by SSH, which often results in a permission denied error.
So, with this basic configuration, the Tsung client starts the load on the same host and on the same Erlang virtual machine as the controller.
The next section defines the phases of user arrival rates. There are only two tags that are allowed inside the load tag: arrivalphase and user.
<load duration="5" unit="second">
<arrivalphase phase="1" duration="3" unit="minute">
<users maxnumber="10" interarrival="2" unit="second">
</users>
</arrivalphase>
</load>
With this setup, during the first 3 minutes of the test, a new user will be created every 2 seconds, then during the next 10 minutes, a new user will be created every second until the number of users reaches 10. The test ends when all users have ended their session.
By default, a load phase ends when the specified duration is reached, even if all started sessions are not finished. If you want to start a new phase only after all users in the previous phase have finished their sessions, use the wait_all_sessions_end attribute of the arrivalphase tag.
You can specify either the arrival rate (the arrivalrate attribute) or an interval between arrivals (interarrival).
<arrivalphase phase="1" duration="1" unit="minute">
<users interarrivals="2" unit="second">
</users>
</arrivalphase>
In the sessions tag, you define the actual series of requests that a virtual user will perform.
<sessions>
<session name="homepage-then-about" probability="70" type="ts_http">
<request><http url="/" method="GET"/></request>
<request><http url="/about" method="GET"/></request>
</session>
<session name="homepage-then-contacts" probability="30" type="ts_http">
<request><http url="/" method="GET"/></request>
<request><http url="/contacts" method="GET"/></request>
</session>
</sessons>
If you need to use the data from the response for the next request in the series, you need to use dynvariable and substitutions:
<sessions>
<session name="user-adds-to-cart" probability="100" type="ts_http">
<request subst="true">
<dyn_variable name="guid" jsonpath="guid"/>
<http url="/api/v2/users/anonymous/carts" method="POST"
content_type="application/json" />
</request>
<request subst="true">
<http url="/api/v2/users/anonymous/carts/%%_guid%%/entries" method="POST" contents='{"product": {"code": "ABC123"}, "quantity": 1}' content_type="application/json" />
</request>
<thinktime value="2"></thinktime>
 </session>
</sessions>
The subst attribute of the request tag is important here: it enables variable substitutions. The substitutions require double percent signs (%%) on both sides of the variable prefixed with the underscore sign (_).
You can’t add the same product into a cart many times, so you need to use a list of products and iterate over them. For this purpose, you can use a combination of FOR and SETDYNVARS:
<options>
  <option name="file_server" id="products" value="product-stock.txt"/>
</options>
<sessions>
  <session name="user-adds-to-cart" probability="100" type="ts_http">
    <request subst="true">
      <dyn_variable name="guid" jsonpath="guid"/>
      <http url="/api/v2/users/anonymous/carts" method="POST"
           content_type="application/json" />
    </request>
    <for from="1" to="5" var="counter">
      <setdynvars sourcetype="file" fileid="products" delimiter="," order="iter">
        <var name="product" />
        <var name="quantity" />
      </setdynvars>
      <request subst="true">
        <http url="/api/v2/users/anonymous/carts/%%_guid%%/entries" method="POST" contents='{"product": {"code": "%%_product%%"}, "quantity": "%%_quantity%%"}' content_type="application/json" />
      </request>
      <thinktime value="2"></thinktime>
   </for>
 </session>
</sessions>
Inside the loop, you can use the %%_counter%% substitution if you find it useful for debugging purposes.
The constant values can be defined in the same configuration:
<setdynvars sourcetype="value" value="foobar">
  <var name="constant" />
</setdynvars>
The variables defined in this way can be used via double-percent-and-underscore substitutions as well.
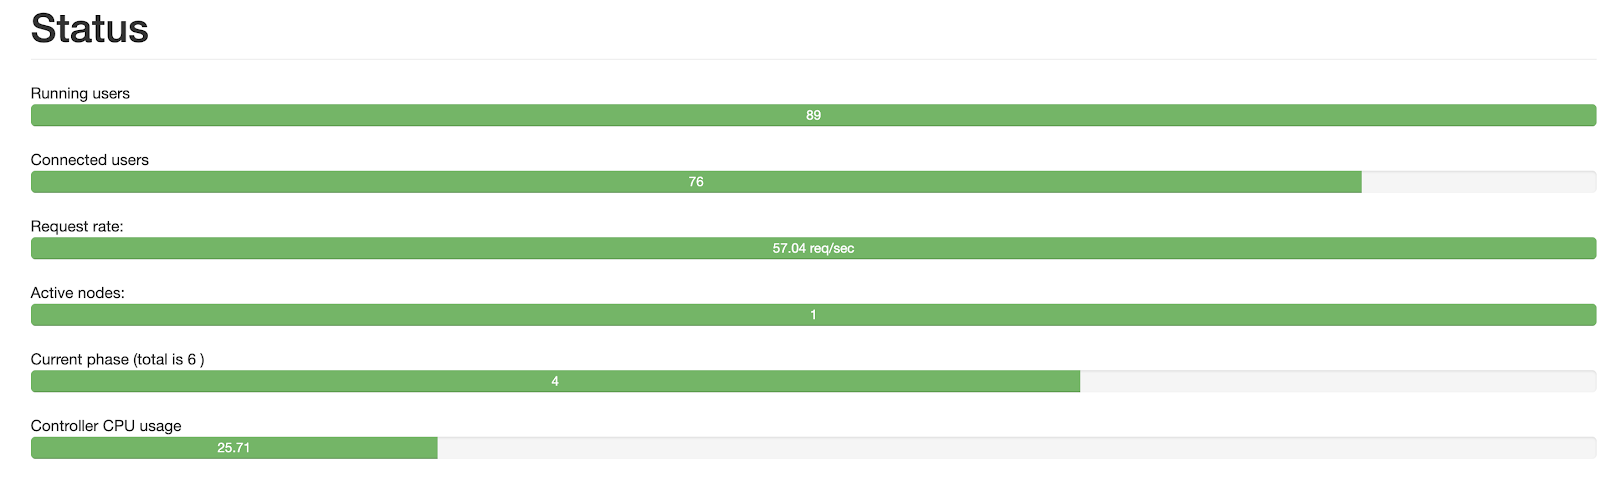
When you run a Tsung controller, you normally see nothing in the console output. For monitoring the load, Tsung provides an embedded web server. It is started by the controller on port 8091:
.png)
During the load, Tsung creates logs. These logs can be visualized using a tsung_stats.pl script.
Tsung has dynamic substitutions to use variables in a similar way to JMeter:
<setdynvars sourcetype="file" fileid="urlList.csv" delimiter=";" order="iter">
 <var name="jsonForPOST" />
 <var name="sku"/>
</setdynvars>
In the Tsung configuration file, you can specify this as follows:
<request subst="true">
<http url='/api/product/%%_sku%% version='1.0'
contents='%%_jsonForPOST%%' content_type='application/json' method='POST'>
</http>
</request>
Sample load
I defined six phases, each lasting one minute. This is the relevant Tsung load definition:
<load duration="10" unit="minute">
<arrivalphase phase="1" duration="60" unit="second">
<users interarrival="1" unit="second"/>
</arrivalphase>
<arrivalphase phase="2" duration="1" unit="minute"><users interarrival="0.1" unit="second"/>
</arrivalphase>
<arrivalphase phase="3" duration="1" unit="minute"><users interarrival="0.05" unit="second"/>
</arrivalphase>
<arrivalphase phase="4" duration="1" unit="minute"><users interarrival="0.01" unit="second"/>
</arrivalphase>
<arrivalphase phase="5" duration="1" unit="minute"><users interarrival="0.005" unit="second"/>
</arrivalphase>
<arrivalphase phase="6" duration="1" unit="minute"><users interarrival="0.001" unit="second"/>
</arrivalphase>
</load>
<sessions>
<session probability="100" type="ts_http" name="createcart-getcart">
<request subst="true">
<dyn_variable name="guid" jsonpath="guid"/>
<http url="/api/v2/users/anonymous/carts" method="POST" content_type="application/json"/>
</request>
<request subst="true">
<http url="/api/v2/users/anonymous/carts/%%_guid%%" method="GET" content_type="application/json"/>
</request>
</session>
</sessions>
...- Phase 1 0-60 sec. 60 users coming one per second during a minute. Total: 60
- Phase 2 61-120 sec. 600 users coming 10 per second during a minute. Total: 60+600=660
- Phase 3 121-180 sec. 1,200 users coming 20 per second during a minute. Total: 60+600+1200=1860
- Phase 4 181-240 sec. 6,000 users coming 100 per second during a minute. Total: 60+600+1200+6000=7860
- Phase 5 241-300 sec. 12,000 users coming 200 per second during a minute. Total: 60+600+1200+6000+12000=19680
- Phase 6 301-360 sec. 60,000 users coming 1,000 per second during a minute. Total: 60+600+1200+6000+12000+60000=79860
The test is limited to 10 minutes.
The actual runtime was 8 minutes.
Machine: MacBook Pro 2.6GHz, 6-core Intel i7.
SAP Commerce Cloud 1811, Cart API.
Explanations of results
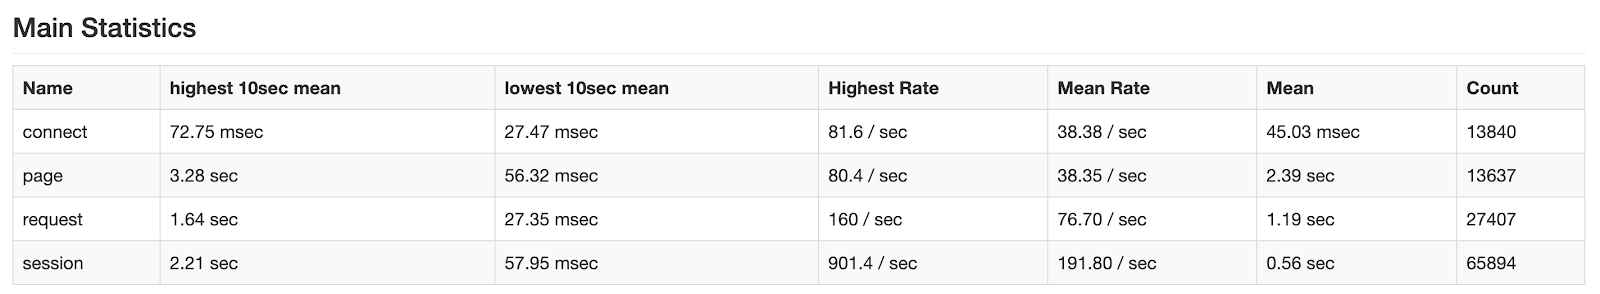
- Connect. Duration of establishing a connection.
- Request. Response time for each request.
- Page. A page is a group of requests not separated by a thinktime. Tsung displays response time for each set of requests here.
- Session. Rate/count of a user session.
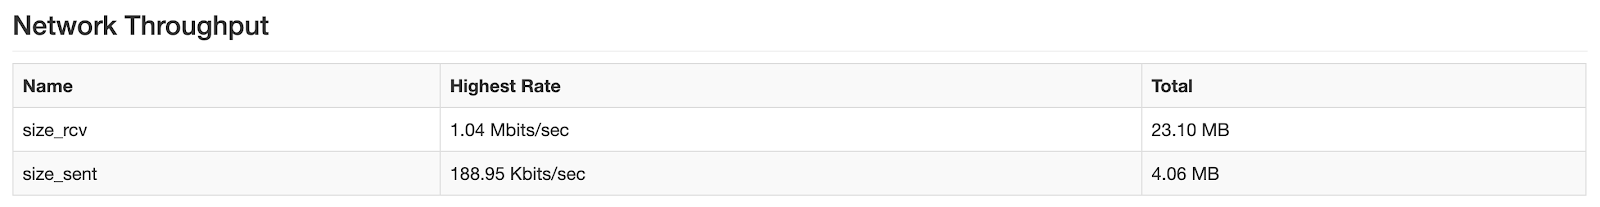
Network Throughput shows the size received and size sent, measured on the Ethernet packets sent or received on each host during the test.
Counters Statistics shows that the highest rate is the computation of the average of the rate performed every 10 seconds (the maximum value for all these estimations).
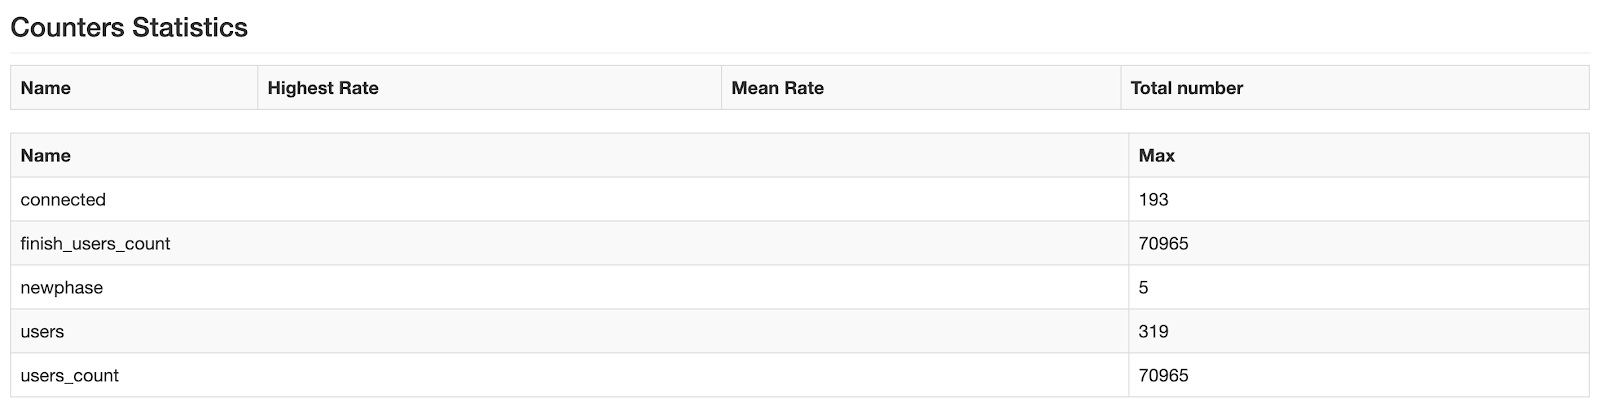
The users_count is the number of users created, and finished_user_count is the total number of users who complete the test.
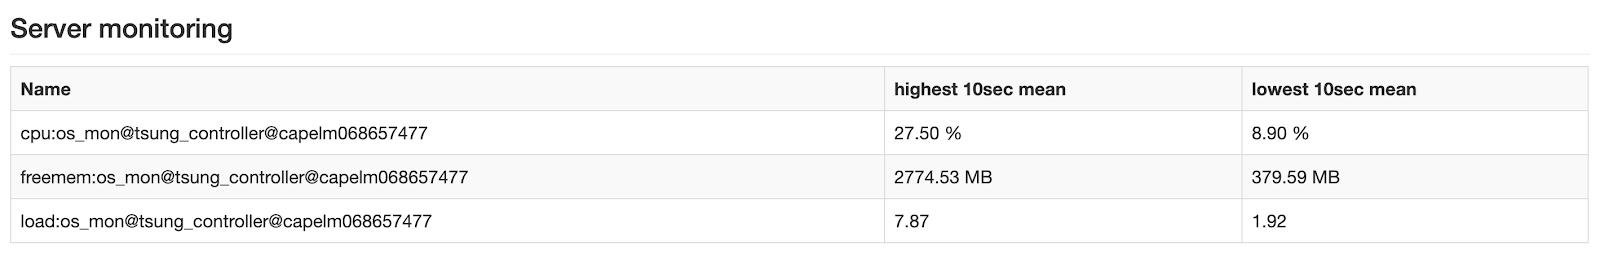
Server monitoring shows the CPU/memory consumption. It is important that there are no agents on the testing system that could collect the CPU/memory information from it, and the system displays the parameters of the system generating the load.
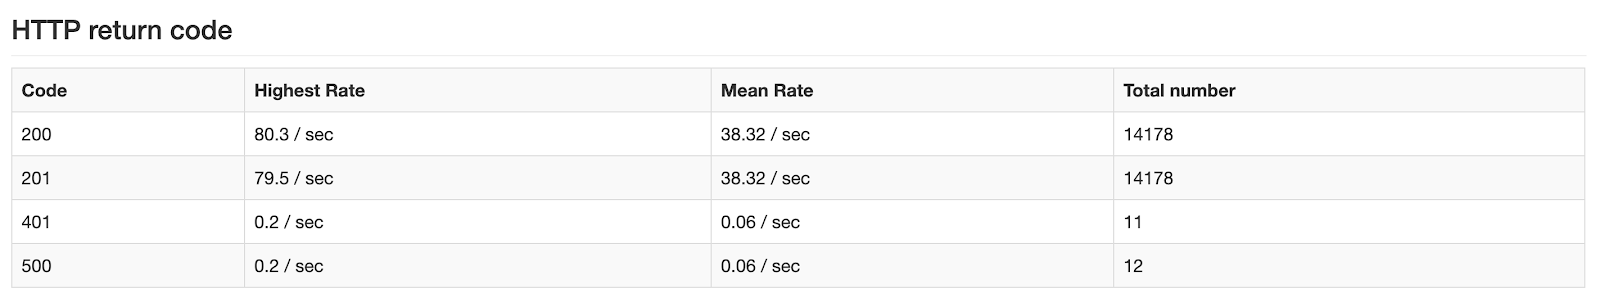
There is also the summary information on the response codes:
Response time in msec for pages and transactions (a page is a group of requests not separated by a thinktime).
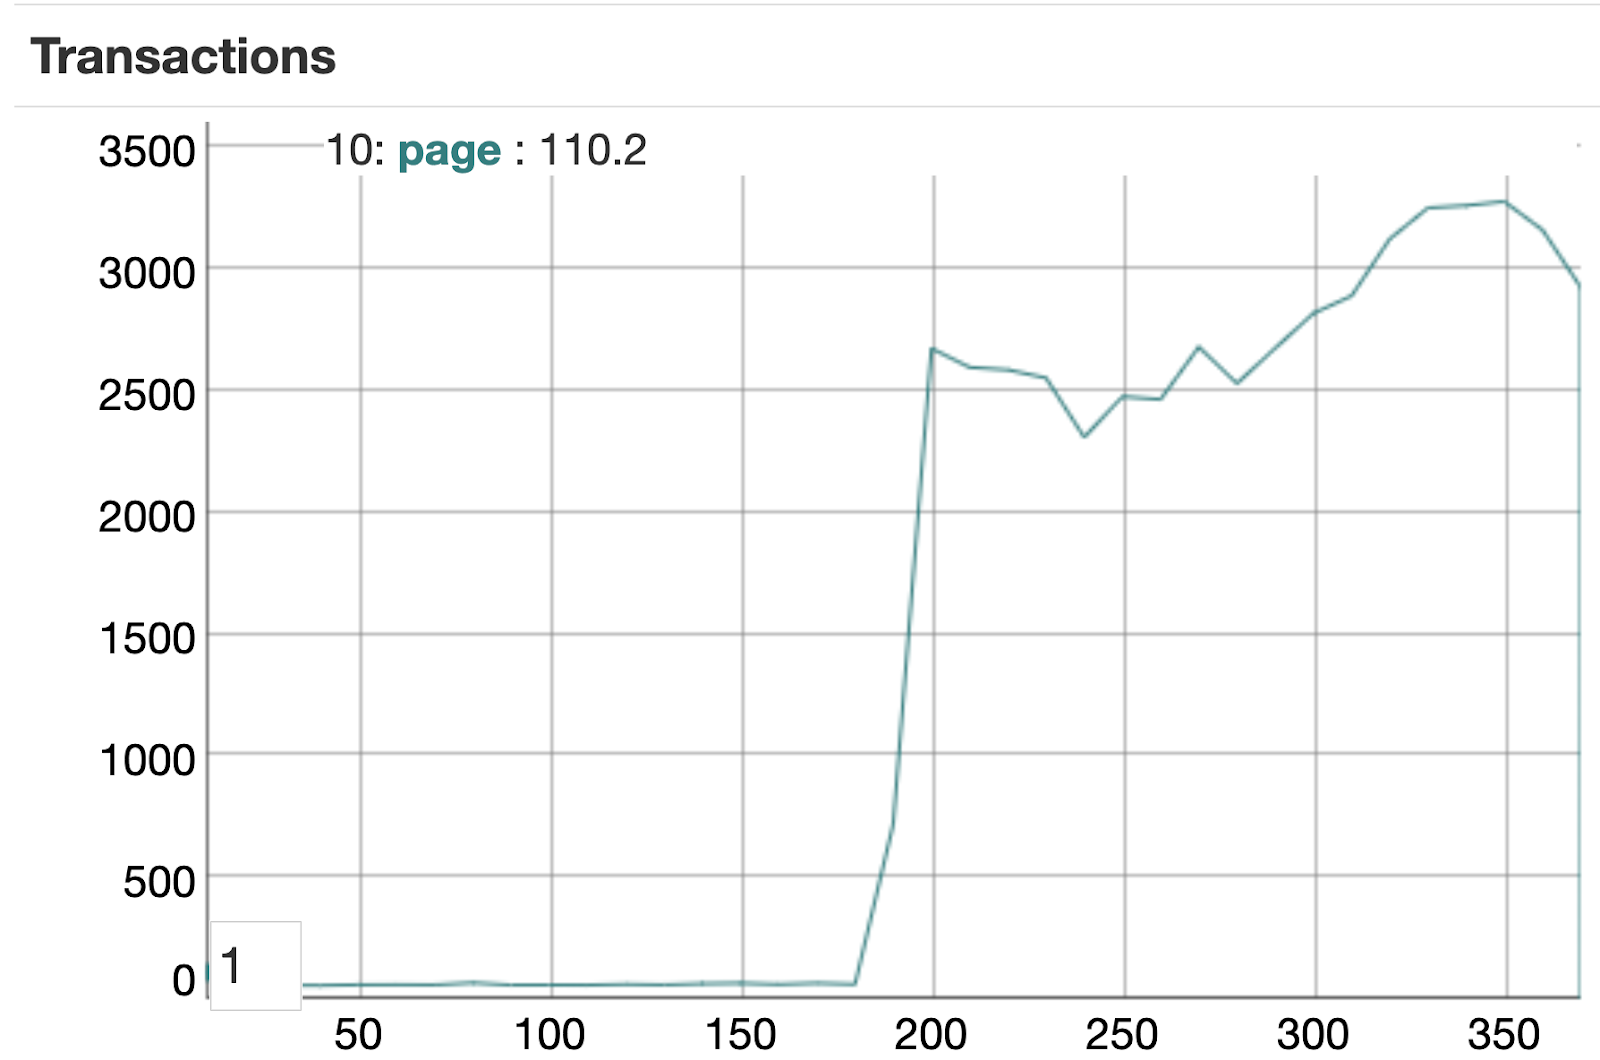
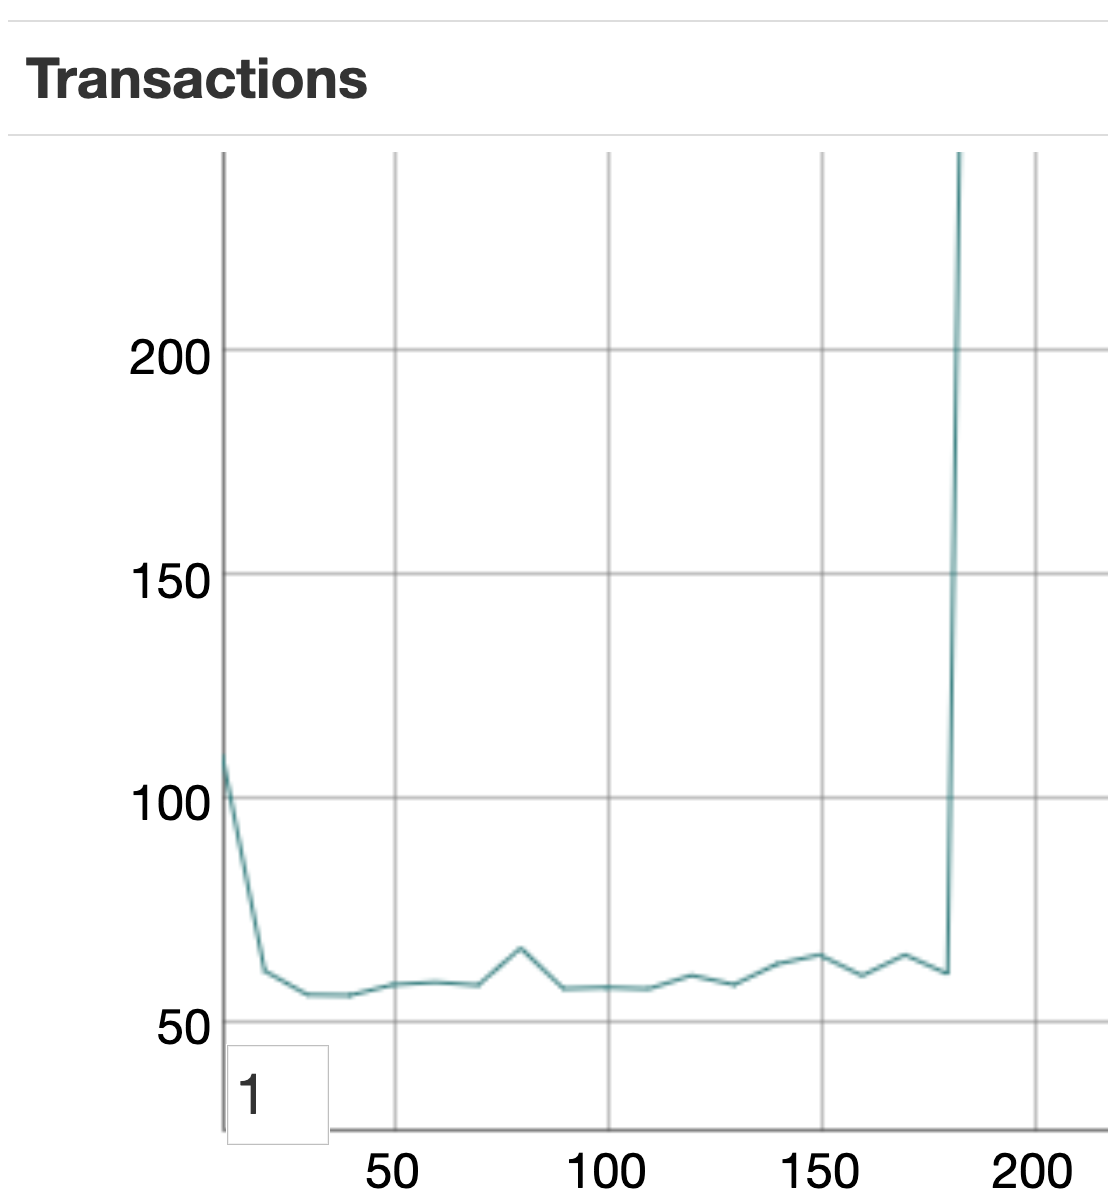
At 180 sec, the response time jumped from 60 msec to 2.6 seconds. This is where the 10/sec phase is replaced with the 20/sec phase.
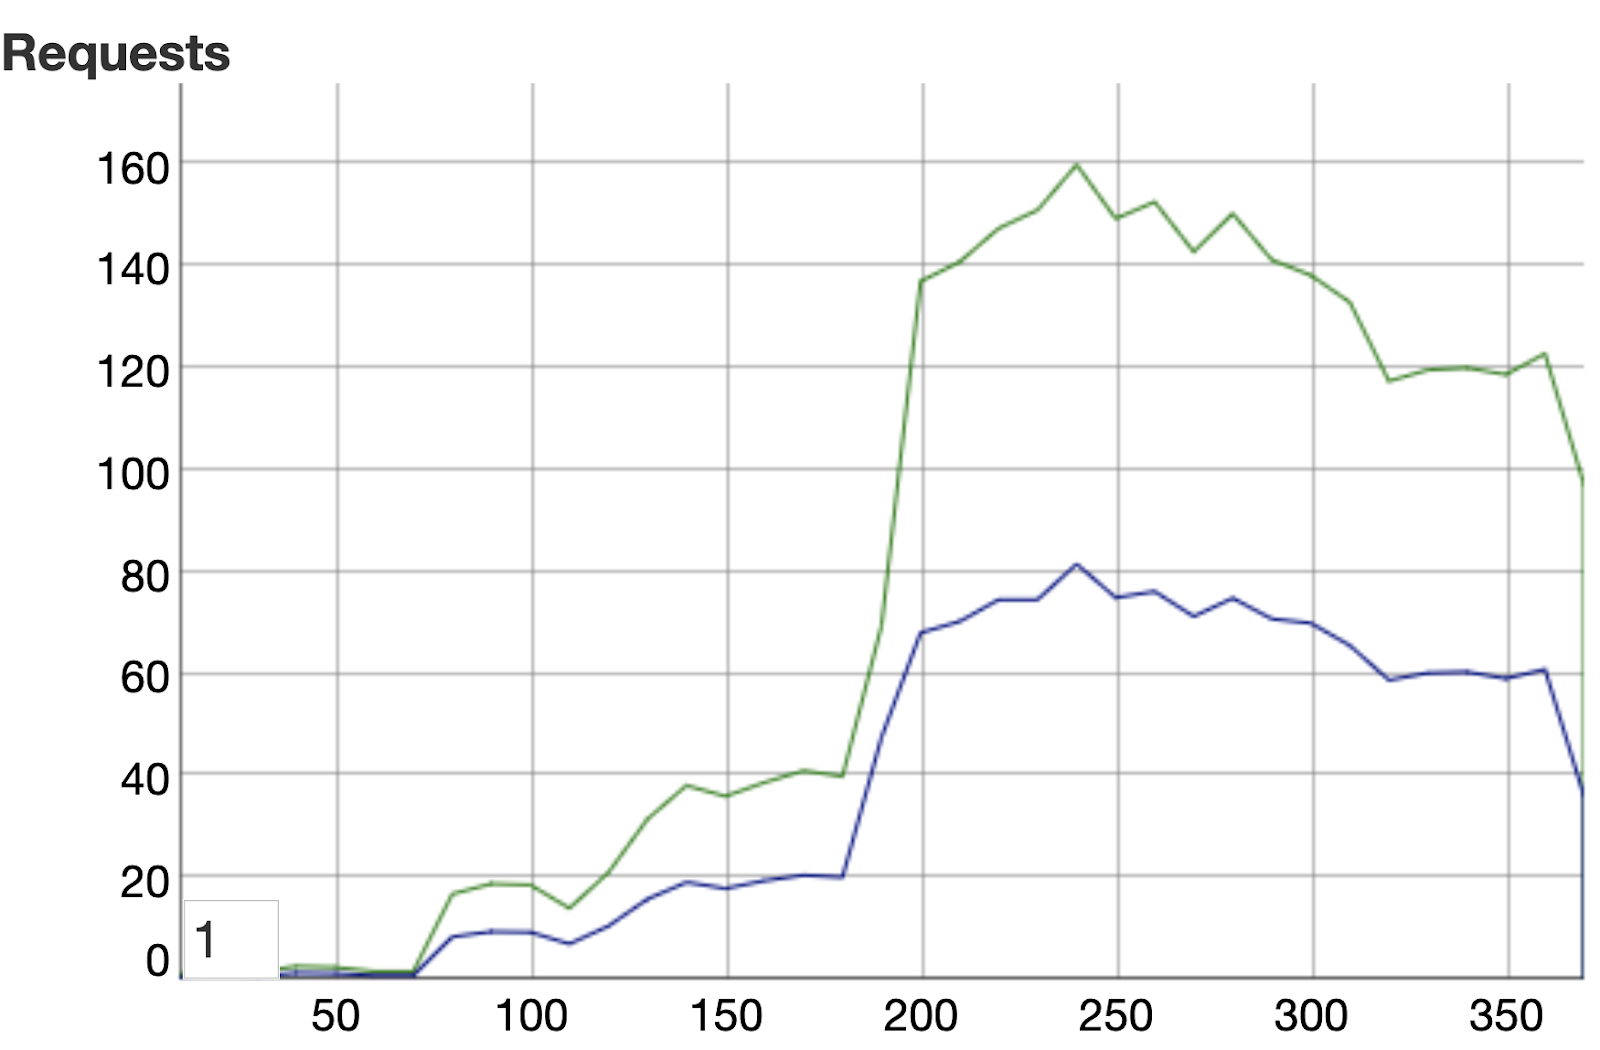
The Request and Connection establishment graph shows the mean duration (in msec) of the requests accepted by the HTTP connect (blue line) and the true request connection time (in msec, green line).
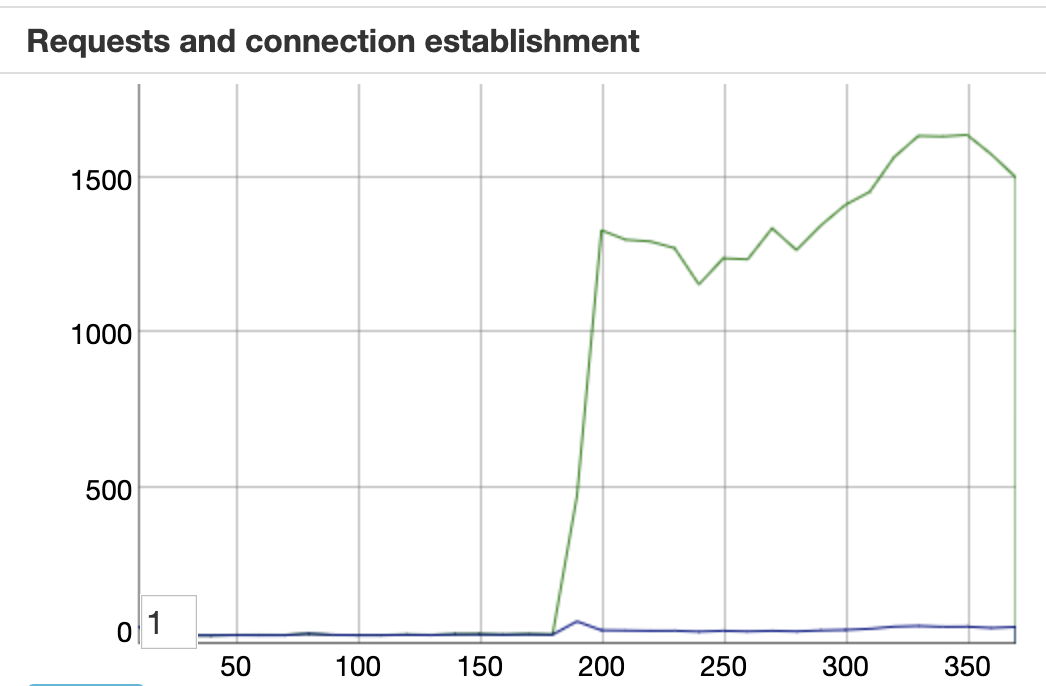
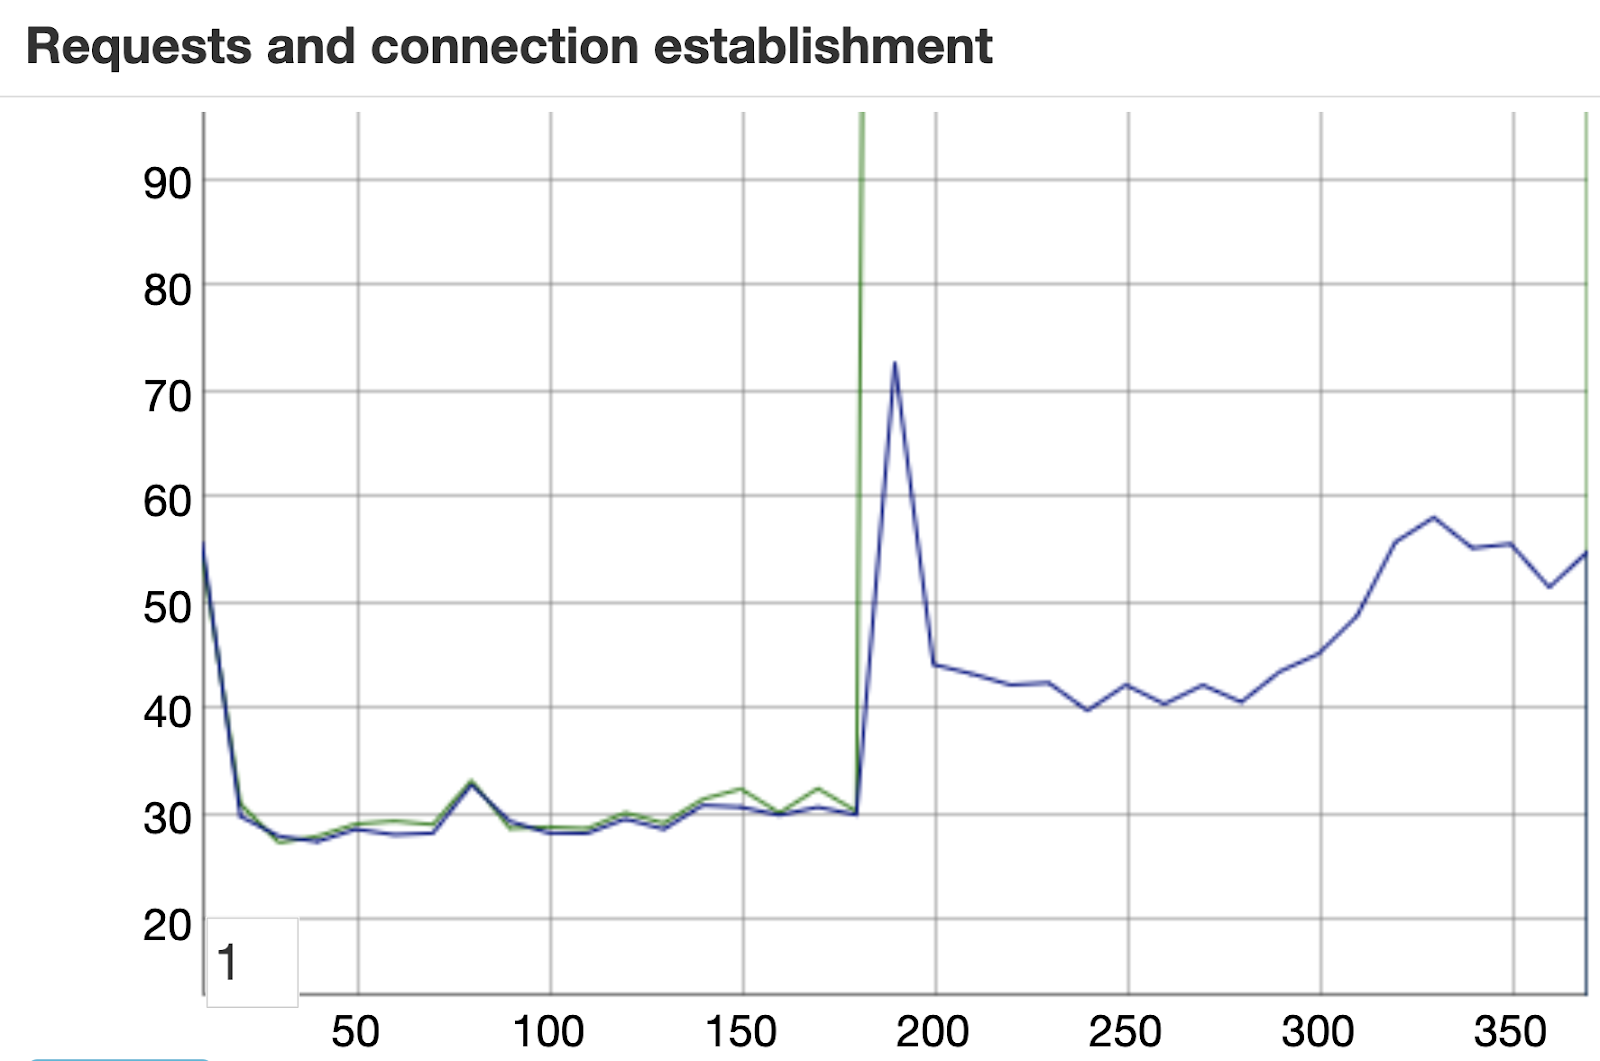
The delta between these lines shows how long the server needs to wait to accept the connection. After increasing the rate from 10/sec to 20/sec, the response time grew significantly, while the connection time increase wasn’t so high. For 10 per second, the server processed the queries almost immediately after accepting the connection.
The system also showed that the maximum number of transactions per second (or sessions, 80/sec) was observed when the request rate was about 200 requests per second (which is ~100 sessions per second). After that, the response time increase resulted in a decrease in the number of transactions.
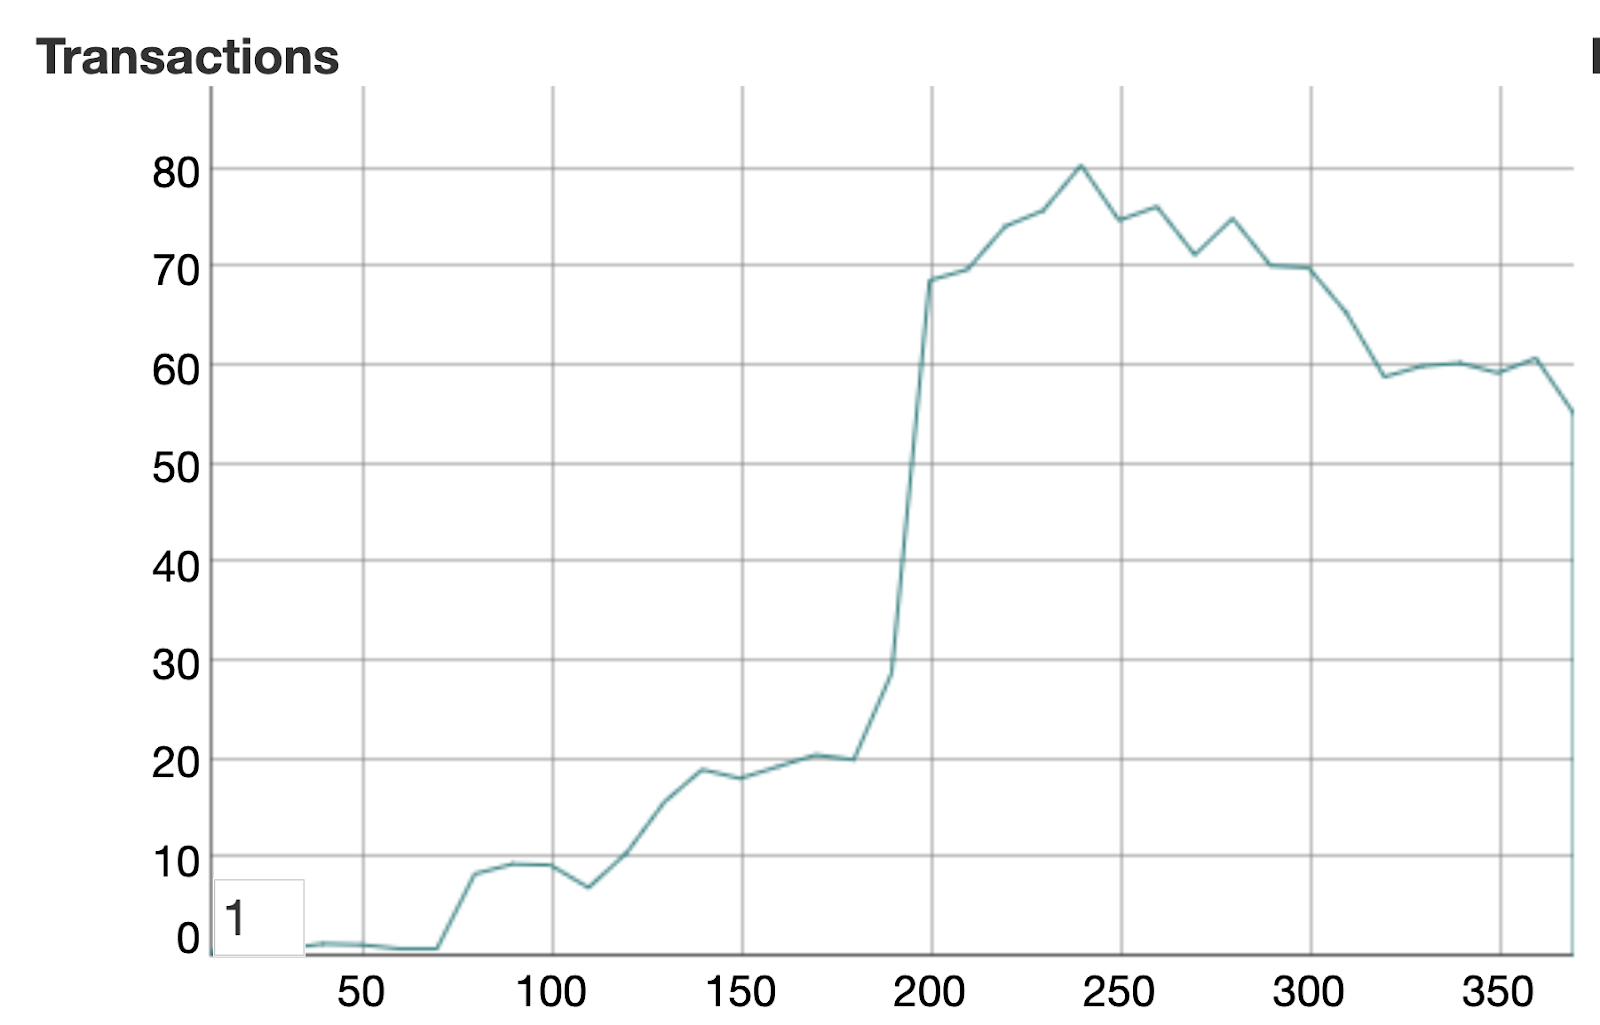
The number of requests is two times more than the number of sessions because each session has two requests (create cart + get cart).
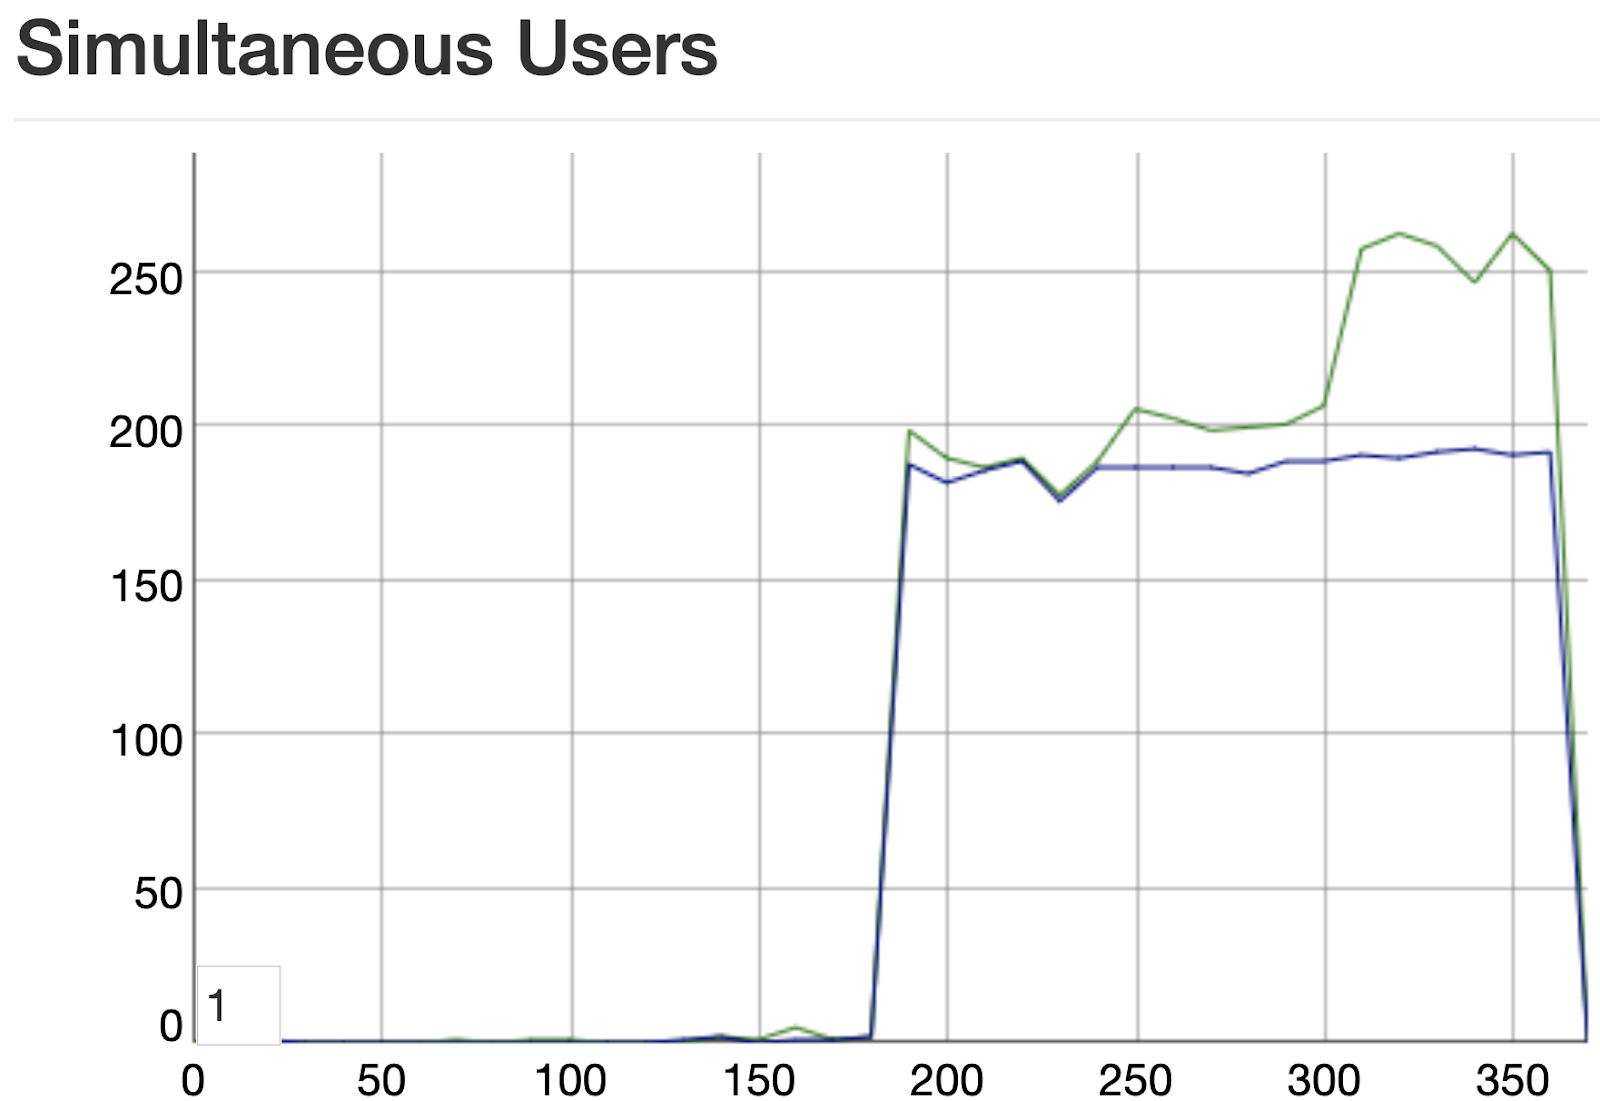
The virtual users are coming one after another. Longer processing time and a higher rate increase the number of simultaneous users.
The green line stands for users (their session has started but has not yet finished), and the blue line stands for opened TCP/UDP connections.

The following graph shows the number of errors detected during the load. Specifically, error_connect_emfile likely means that we are running out of file descriptors (I have 256). The operating system uses file descriptors to handle file-system files as well as pseudo files, such as connections and listener sockets. Because of this limit, we could not go beyond the limit.
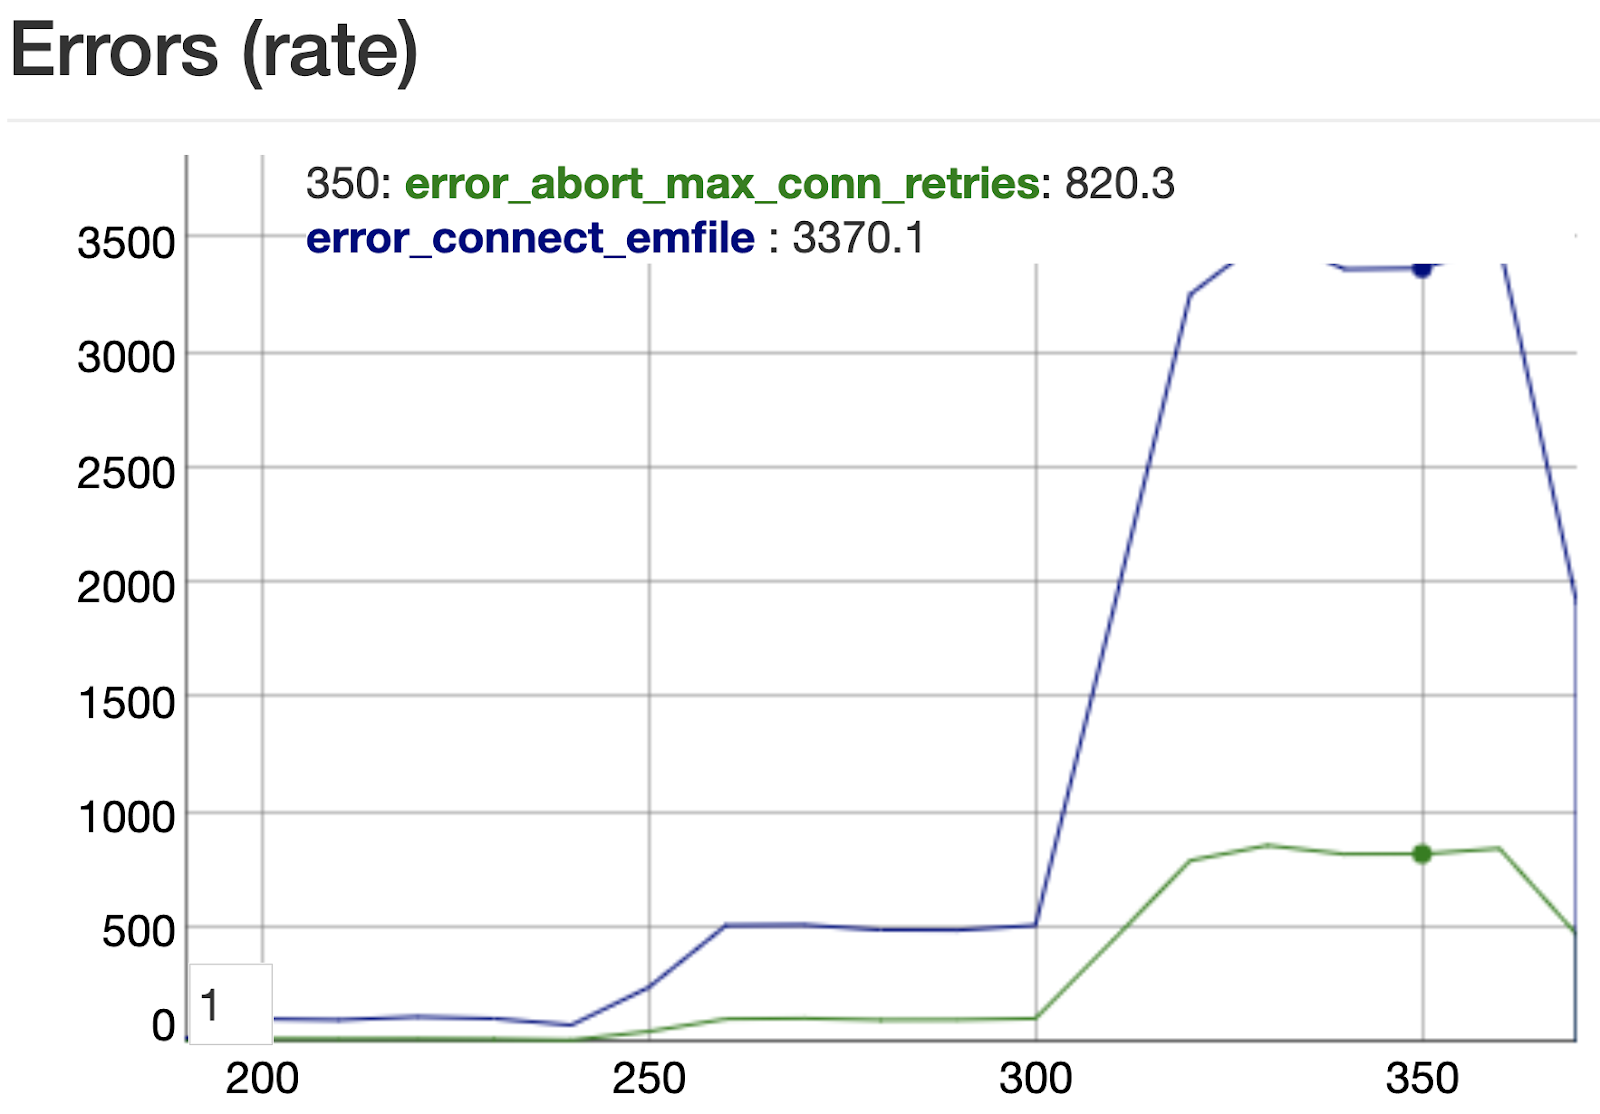
Tsung’s maximum number of connection retries is 3, and when its attempts fail after the third retry, it throws this error, and the graph shows their number. The default timeout between retries is 10 seconds.