Tracking and Visualizing Real-Time Operational Metrics in E-commerce
 In one of my projects, it was crucial for me to monitor data volumes and some specific e-commerce system parameters and alert the technical team if there were any abrupt or unexpected changes in them. These fluctuations occasionally (though not always) signaled potential existing issues or an increased likelihood of future problems.
I am focusing on operational parameters (orders, shopping carts, customers, logins, product data quality), not technical (page load time, timeouts).
Due to the lack of built-in solutions in SAP Commerce for this function, I had to design and implement a custom solution from the ground up. This article delves into the specifics of that development process and details of the architecture.
Problem Statement
In brief, the problem lies in the need for a custom solution to monitor sudden changes in data volumes and internal system operational parameters, ensuring prevention of performance disruptions and maintenance of operational stability.
For instance, an e-commerce system imports some data items from an external system, such as products with their characteristics, prices, and inventory levels. Typically, the volume of these products remains within certain limits day-to-day—until, at some point, it suddenly doubles. Such events usually create extra load on the system, which could lead to slowdowns or even failures. If you tested your system with a twofold margin, one day you might face a fourfold increase.
While individual changes like these can be anticipated, there’s always a chance that multiple factors may overlap.
Any automatic outlier and anomaly detection begins with defining what constitutes them and classifying them into categories of noteworthy or not. And it is where visualizing is very beneficial.
If a sudden increase in volumes can indicate performance issues, an unexpected drop might forewarn of a decline in sales. Drops may also indicate that something is wrong with the website — for example, customers can’t login or can’t checkout in some particular scenarios. Naturally, it would be beneficial for the team to see this before it impacts sales.
In e-commerce projects, including those built on SAP Commerce Cloud, a particular challenge is monitoring the growth of tables in production and maintaining cleanup procedures in operational condition. Sometimes, these procedures are designed in such a way that a malfunction goes unnoticed until it causes a significant issue. Of course, this too can be managed with detailed logging and alert settings, but again, visualizing their operation is never superfluous.
So, we can organize the metrics into two categories, operational and technical metrics.
Operational Metrics
These metrics are associated with business processes and operational activities. Examples include “call center order processing time” or “number of orders per unit of time”. These indicators measure the efficiency of personnel or operational systems, as well as the overall productivity of business processes.
Technical Metrics
These are metrics related to the technical aspects of system operations, such as “server response time” or “module execution time”. These indicators reflect the efficiency and speed of servers, software, or other technical processes.
Usually, some metrics, such as related to performance, are available in Dynatrace and similar systems designed for the purpose. However, measuring them in code is also important, as it is often beneficial to combine them with the non-technical metrics, such as number of items received or sent.
What to measure
First and foremost, it’s crucial to define what we measure. As the famous saying goes, “If you can’t measure it, you can’t manage it.”
Item Counts and Table Sizes
Monitoring the size of critical tables is important to predict and manage growth trends. This is particularly important for tables that grow rapidly, like transaction logs or information attached to the user sessions.
This is likely the most important aspect for almost all system, but particularly for ones based on SAP Commerce. It turns out that very few places actually monitor the growth rate of their tables—until they become so large that the system starts to noticeably slow down. This is mainly not done due to the lack of ready-to-use tools the platform provides out of the box. Data retention and cleanup mechanisms, which remove data from tables, require time both to develop and to apply, and the system slowdown can depend non-linearly on the volume of data, with the slowdowns accelerating each day. Therefore, it’s important to understand what’s happening with the data volume.
I mentioned SAP Commerce, but, of course, it does not depend on the platform, it is important everywhere. In the case of the platform, a programmer might get the impression that the platform developers have already thought of everything, and once their module is up and running, they can relax. However, logically, cleanup mechanisms should be included as part of the scope for the module.
I recommend including all variable items (more exact, their counts) that are dependent on external factors. For instance, the volume of orders and customer registrations depends on website traffic, while the inventory and inventory levels depend on what the master systems provide. In fact, it’s useful to monitor any entities whose numbers are influenced in any way by what external systems return or send.
Next, I recommend subdividing some of these objects into subclasses. For example, products with and without prices, those available in stock and those that are not, new and returning customers etc.
Tracking shopping carts, products, categories over time are based mainly on item count metrics. Of course, some of such entities probably need additional monitoring (such as data quality check), but checking counts is the must.
Business Processes
Objects with variable status or statuses, where an external factor is also involved, deserve special attention. A good example is the order fulfillment process, which consists of a series of steps linked by business rules. A typical e-commerce store may have more configured business processes (consignment, payment etc.).
Examples:
- Order Processing Time. From order is placed to order is shipped.
- Orders Processed per Hour: How many orders packed and shipped per hour.
Since business processes vary from one company to another, it is difficult to offer universal advice here. Consider what may make your process less than perfect and how to measure the gap.
Cronjobs
For the Cronjobs section of your operational metrics tracking, it’s essential to monitor not just their completion and execution time but also other aspects that could provide deeper insights into system health and efficiency.
The aspects depend on the implementation details, so it is hard to give universal advice here.
Basically, for each cron job, ask yourself: “How critical is it if it does not start on time for some reason? And again? And once more?” And then, at some point, you need to draw a red line, after which the monitoring system should raise an alarm.
Prices
I recall two instances from my experience when, due to malfunctions in an external system relative to the ecommerce platform, certain products received odd prices—like zero-dollar. Before this happened for the first time, we did not consider testing the system to see if it would display a product at a zero price. In fact, many online stores will readily display a zero price if it comes from a trusted source. The situation is somewhat worse if the price is not zero but near-zero or the delta between the normal price and new price is abnormal and non-intentional. In such cases, legal risks arise—what if a customer orders such a product? An explanation about a bug in the system may not be a sufficient argument in some countries to avoid delivering the paid product.
In one of my recent projects, I included monitoring for the minimum price. It turned out that the minimum price could not be below a few thousand dollars. Thus, any errors with a zero price or a $1 price were definitely covered by the monitoring. But what about situations where the price drops from $30,000 to $3,000 due to a bug?
For this, it makes sense to monitor not only the absolute deltas between the current price and the price received last time but also the relative indicator (new price/old price). Displaying the maximum delta and the relative change on a chart can be useful. False alarms may occur periodically, but checking doesn’t take much time.
Inventory
In e-commerce operations, a critical component to success is the management of inventory levels. It is essential to monitor scenarios where products sell out faster than they are restocked, as these can significantly impact sales and customer satisfaction.
To effectively manage these dynamics, it’s advisable to develop metrics that quantify the rate of inventory turnover and replenishment. These metrics could include:
- Inventory Sell-through Rate per Category: This metric measures how quickly inventory is sold after being stocked. In other words, it measures the percentage of inventory sold over a specific period. A high sell-through rate might indicate strong demand or possibly understocking issues. When dealing with a large inventory categorized into different groups (e.g., electronics, clothing, accessories), it is practical to aggregate the sell-through rate by these categories to get a clearer picture of category performance.
- Restock Frequency: Tracks how often inventory is replenished over a given period. Infrequent restocks combined with a high sell-through rate could signal potential stockouts.
- Time-to-Restock: Measures the time it takes from a product selling out to it being available again. This metric is critical for assessing the responsiveness of the supply chain.
By monitoring these metrics, teams can identify trends and potential discrepancies in inventory management, allowing for timely adjustments to ordering processes or supplier negotiations. This proactive approach ensures that inventory levels are optimized, reducing the risk of lost sales due to stockouts while avoiding excessive overstocking.
Indexing
Overall, indexing is done through Cronjobs, so the execution time and success will be reflected in the Cronjobs metrics. I also recommend checking that the indexing has been completed correctly. This greatly depends on the specific architecture, but, for example, you could calculate the difference between the number of items indexed and the items that should have been indexed. Right after a successful indexing, this difference should be zero, but then, between indexing events, a small discrepancy might occur. The goal of the metric is to track this discrepancy and trigger an alert if it exceeds a certain threshold.
In my project, all products (about 100,000) were regularly selected from both Apache Solr and the database, and then the system compared these sets. The comparison results included the number of matching items, the number of mismatches due to price, separately due to inventory levels, and separately due to product characteristics. Since there is a delay between the time the price or inventory levels are updated in the database and when they are updated in SOLR, non-zero values are possible during metric calculation, but such “peaks” are typically short-lived. However, if these peaks are not short-lived (i.e., they exceed the indexing period), this signals a problem.
Product Data Quality
In SAP Commerce Cloud, a Data Quality Coverage Dashboard is typically used to monitor and enhance the quality of product data. The dashboard provides insights into how well the product data covers the necessary attributes and requirements defined in the system, which is crucial for effective online retail operations.
The coverageIndex is a metric that quantifies the completeness of data attributes for products in your catalog. It is generally calculated by the following formula:
coverageIndex(P) = # of required attributes / # of populated
Total number of required attributes refers to the total attributes that are necessary for a complete product record, but not marked as mandatory.
The relevant metrics could involve coverageIndex as well as the product creation time
- number of products with coverageIndex below some threshold X
- number of products created more than N days ago with coverage index below X
- etc.
Data Health
Also it is useful to check for data integrity issues, such as orphan records that no longer link to parent entities but are still consuming space, and for unexpected duplicates that can affect data quality and system performance.
Integration
Integration with external systems often becomes a critical aspect. Therefore, identifying and monitoring key integration points like APIs that handle order placements, payment processing, and shipping status is essential. These integration points should be closely observed for response times, error rates, and throughput to ensure they do not become bottlenecks.
Normally such monitoring is part of Dynatrace or similar tools, but sometimes we need to map technical metrics with operational metrics. For example, your API returns a list of stores, and you may find it useful to track and visualize this number over time.
Architecture and Technical Solution
In essence, the task is divided into four subtasks:
- where and how to accumulate data on metrics
- where and how to perform the aggregation of primary metrics into more complex ones (for example, determining the rate of growth based on growth)
- how to visualize metrics
- how and whom to notify and in which cases
What SAP Commerce provides out of the box for the purpose?
Let’s begin by acknowledging that the task of collecting and displaying metrics is not inherently a function of an e-commerce platform. Storing metrics requires a dedicated solution, as using a conventional database would not only be inefficient but also lack the necessary performance. Moreover, processing these metrics could potentially divert essential resources from the core functions of the e-commerce platform. Therefore, I would advise against integrating metric display capabilities directly into the SAP Commerce Backoffice, as it is likely to introduce more challenges than benefits.
Let’s take a look at what SAP Commerce offers “out of the box” for this purpose.
SAP Commerce Backoffice provides some tooling for simple dashboards:
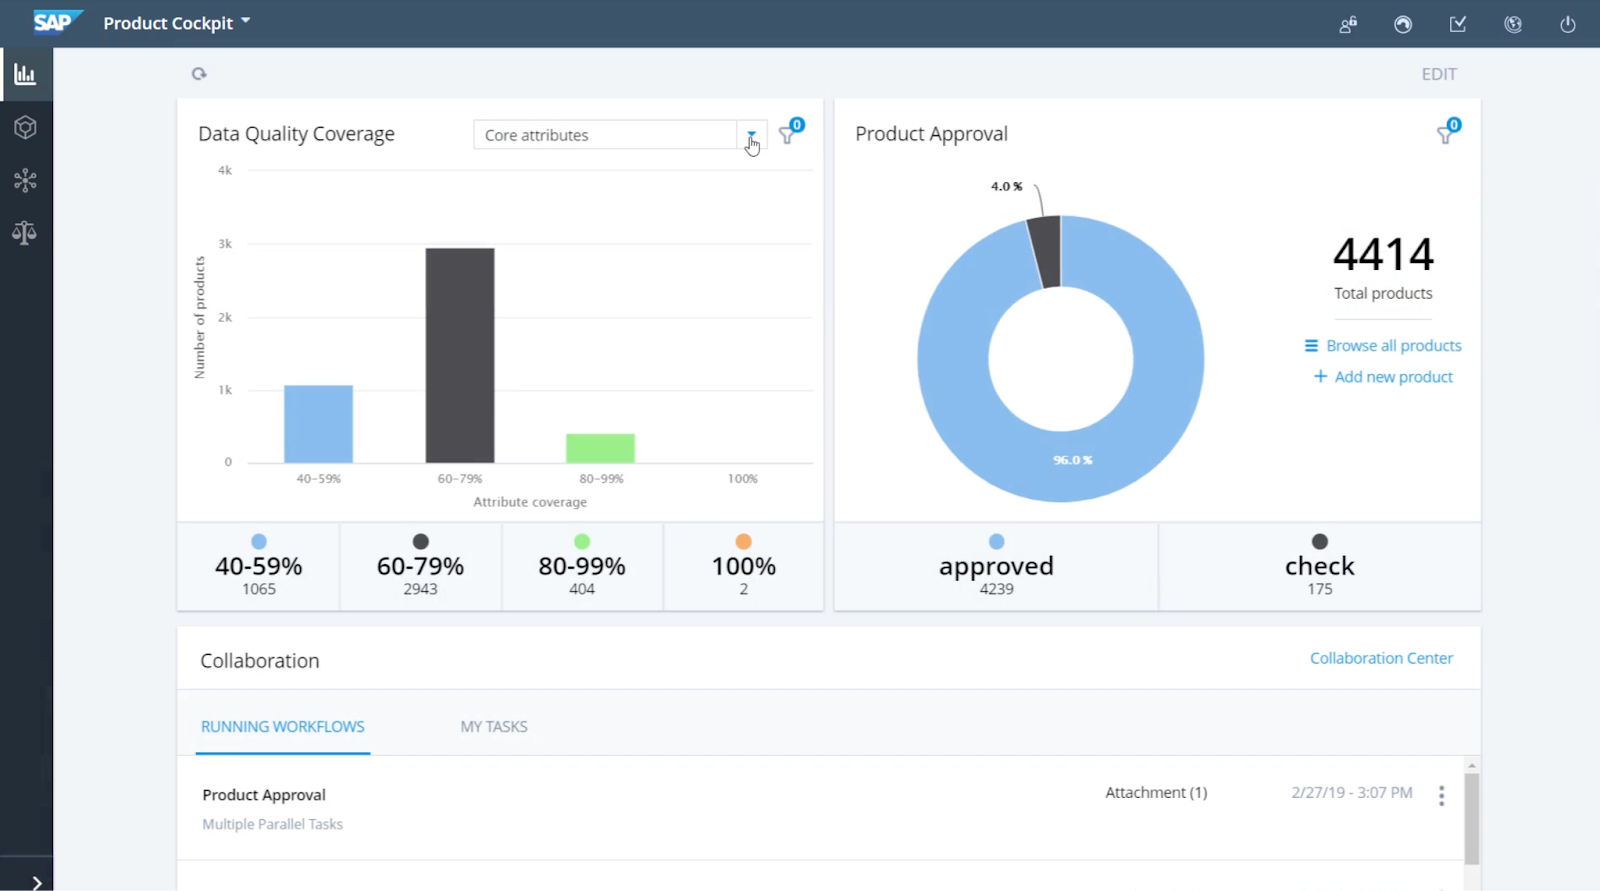
This screenshot shows the data quality dashboard that shows statistics of the products and product approval stats.
Backoffice Framework (built on top of ZK) provides the Dashboard widget component which is a layout widget serving as a place to put other widgets, mainly some charts with statistics or similar.
The ZK Charts library that is used to plot charts in Backoffice uses the Highcharts library. The library allows you to export the rendered chart to a file (for example: PNG, SVG or PDF). By default Highcharts use external service (http://highcharts.com</a >) to process the data to prepare the file.
This service is external, and you should not treat it as trusted. It may happen that the service is not even available, for example due to Internet connection availability or any other reason, and the application may become idle or instable due to that fact.
<bean id="ordersChart" lazy-init="false">
     <constructor-arg name="name" value="orders" />
     <constructor-arg name="unit" value="Orders" />
     <constructor-arg name="statisticsService" ref="statisticsService" />
     <property name="basicLines">
        <list>
           <ref bean="orderStatisticsCollector" />
        </list>
     </property>
</bean>
<bean id="orderStatisticsCollector"
     parent="abstractNaftaStatisticsCollector">
     <constructor-arg name="label" value="Order"/>
     <constructor-arg name="name" value="orders"/>
     <constructor-arg name="flexibleSearchQuery" value="SELECT {pk} FROM {Order} WHERE {modifiedTime} > DATE_SUB(NOW(), INTERVAL 3 MONTH)"/>
     <property name="flexibleSearchService" ref="flexibleSearchService"/>
 </bean>
public class DbStatisticsCollector
   extends AbstractStatisticsCollector
   implements BasicStatisticsCollector {
private String flexibleSearchQuery;
…
@Override
    public float collect() {
        if (!getSessionService().hasCurrentSession()) {
            getSessionService().createNewSession();
        }
        return flexibleSearchService.search(flexibleSearchQuery).getCount();
    }

@Override
    public boolean evaluateValue(float v) {
        return v >= 0;
    }
…
}
The approach above works well only for lightweight and simple diagrams. When it comes to monitorings hundreds of parameters for which you need to query huge tables, the OOTB approach won’t work.
Solution details
I should mention that there are many solutions available for this task, catering to different budgets and requirements for potential expansion. I am sharing the simplest yet sufficient solution for the team, which has been implemented and in use for a long time.
I designed and implemented such a solution, and below are key highlights and technical details.
Prometheus and Grafana for Collecting and Visualizing Metrics
For collecting and visualizing metrics, I used on-premises Prometheus and Grafana. These tools are easy to configure, highly flexible, and come with many extensions. Additionally, both solutions are free and open-source. There are also several SaaS solutions available that offer this functionality, taking on all the support responsibilities.
Prometheus can pull metrics from external systems using a simple format called the Prometheus Exposition Format. This format is essentially plain line-by-line text and is designed to be human-readable:
orders_total{status="new",code="200"} 1027
Once Prometheus scrapes the data, it stores the metrics in its time-series database, enabling efficient retrieval, querying, and graphing of historical data.
For visualization, I used Grafana, which is a powerful and widely-used open-source analytics and monitoring solution. Grafana excels in turning collected data into beautiful graphs and visualizations, making it easier for users to understand and act upon the insights derived from their data.
Grafana uses Prometheus’s query language (PromQL) for querying the data. For example, the query
rate(orders_total{status="new"}[5m])
would show the rate of new orders per second, averaged over the last 5 minutes.
Grafana also supports alerting based on the data trends. You can set up alerts directly in your dashboards. If a metric goes above or below a defined threshold, Grafana can notify you via email, Slack, or other notification channels.
Dashboards can be easily shared among team members or across the organization. Grafana also supports snapshot and sharing features, allowing users to share their dashboards externally without giving access to the underlying data or the Grafana instance.
Both Grafana and Prometheus support a wide range of plugins that extend their functionality. This includes plugins for different data sources, apps for additional functionality, and panels for new ways of data visualization.
Both products are open-source and free to use. They are distributed under permissive licenses that allow you to use, modify, and distribute them without a cost.
Exporting Metrics from SAP Commerce
For SAP Commerce, I created a module responsible for exporting calculated metrics. This module is very simple:
<your domain>/metrics
returns a long list of all metrics to be consumed by Prometheus. The values displayed are taken from the database, where they are stored by a separate process dedicated to calculating these metrics (see the next section)
Make sure to properly secure the /metrics endpoint. Restrict access to this URL to only trusted networks or users. Consider implementing IP whitelisting and/or authentication to protect the data transmitted. This step is essential to prevent any potential data breaches or unauthorized access to your system metrics.
Calculating Metrics in SAP Commerce
In my solution for SAP Commerce, the metrics were calculated by a dedicated cronjobs. This cronjobs were composed of distinct “modules,” each with its own recalculation schedule.

The cronjobs can be triggered every N minutes. These cronjobs launch metric calculation modules, one by one.
Upon startup, this cronjob checked which modules were due to recalculate their metrics.
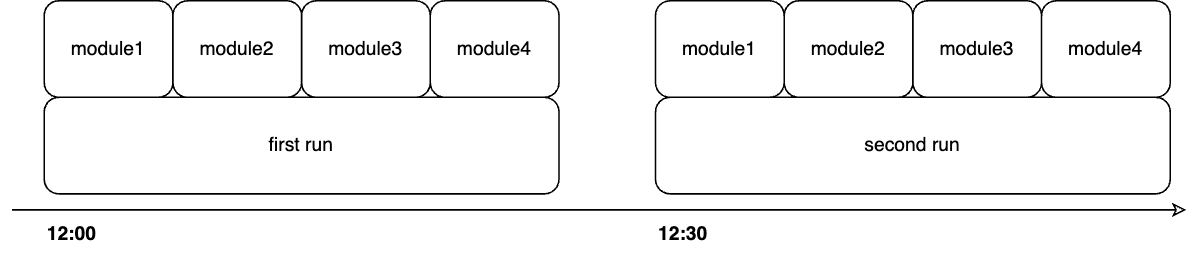
In my solution, the modules were launched sequentially. Overall, it could have been modified to allow for parallel execution, but this was also achievable without any changes: by creating multiple cronjobs, each with its own set of modules and schedule, the modules would effectively be launched in parallel.
Each module had two parameters: the frequency of recalculation and the duration for which the metric is considered current. For example, a module calculating the number of products in the database might be set to “every 30 minutes” with “data current for one hour.” This means that if, for any reason, the cronjob fails to run, the data will completely disappear after a maximum of one hour. However, until that time, the last calculated value will be provided.
A module can create any number of metrics, but typically it generates one or two data metric items. Additionally, two “technical” metrics are automatically added on top of them: one showing the duration of the module’s operation in seconds, and another indicating the exact time the metric was calculated (date and time).
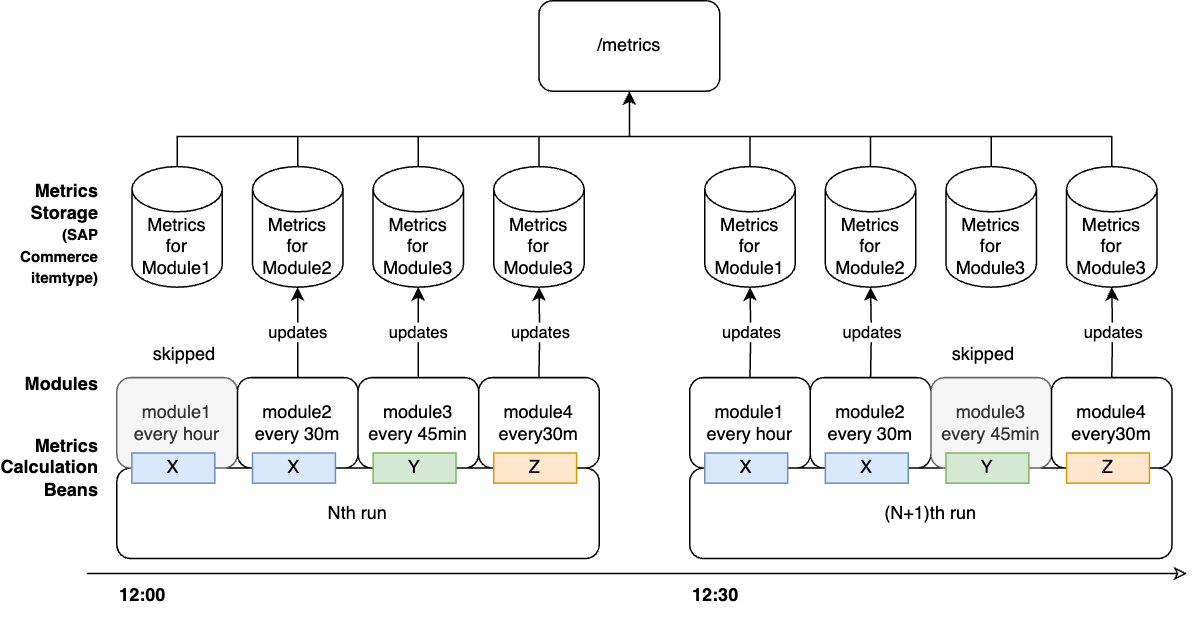
One of the module configuration parameters is a Spring bean that performs the actual calculation. On the diagram it is called “Metrics calculation components”. There is also a parameter that carries the configuration for this bean. For example, the calculation of item counts for orders and products is performed by different modules (which may have their own recalculation frequency schedules), but the actual calculation is done by a single bean called itemCountCalculation. The parameter for this bean specifies the itemType for which the calculation is to be conducted and the filtering conditions.
Each module is triggered by the Cronjob in a cycle if the module is marked as active and if the scheduled time for its activation has arrived. Each module has its own launch schedule, effectively making it a cronjob-within-a-cronjob.
Since our modules each have their own schedules but are all triggered by a single Cronjob, a situation can arise where the entire cycle across all modules takes longer than the frequency set for any individual module. For instance, you might want to calculate the order count every 5 minutes (which itself takes only seconds), but you also have a module calculating discrepancies between the database and Apache Solr, which takes 20 minutes. As a result, the order count will not be recalculated every five minutes as intended.
To address such cases, I recommend creating multiple independent “parent” cronjobs, each initiating groups of modules according to their own schedules. Specifically, the order count would be managed by a cronjob 1 set to run every 5 minutes, while the discrepancy calculations would be handled by a separate cronjob 2 scheduled every 30 minutes. Even if the discrepancy module is set to “every 20 minutes,” it will actually run every 30 minutes because the “parent” cronjob is configured that way. To avoid confusing the support team managing this setup, it’s advisable to align the module’s settings from 20 to 30 minutes as well.
Importing metrics to Prometheus from SAP Commerce
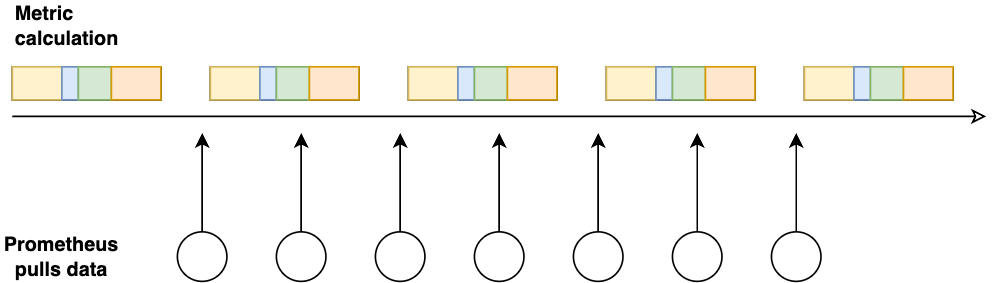
SAP Commerce exposed a /metrics endpoint to be consumed by Prometheus. Prometheus pulls metrics from SAP Commerce every N minutes which should be less than the cronjob’s. The /metric exporter was lightweight in SAP Commerce because it just built a JSONs from the database with pre-calculated metrics.
Grafana
Basically, Grafana is just a visualization tool that allows you to create, explore, and share dashboards displaying data in a variety of formats, such as graphs, charts, and alerts. Grafana supports many different data sources, including Prometheus.
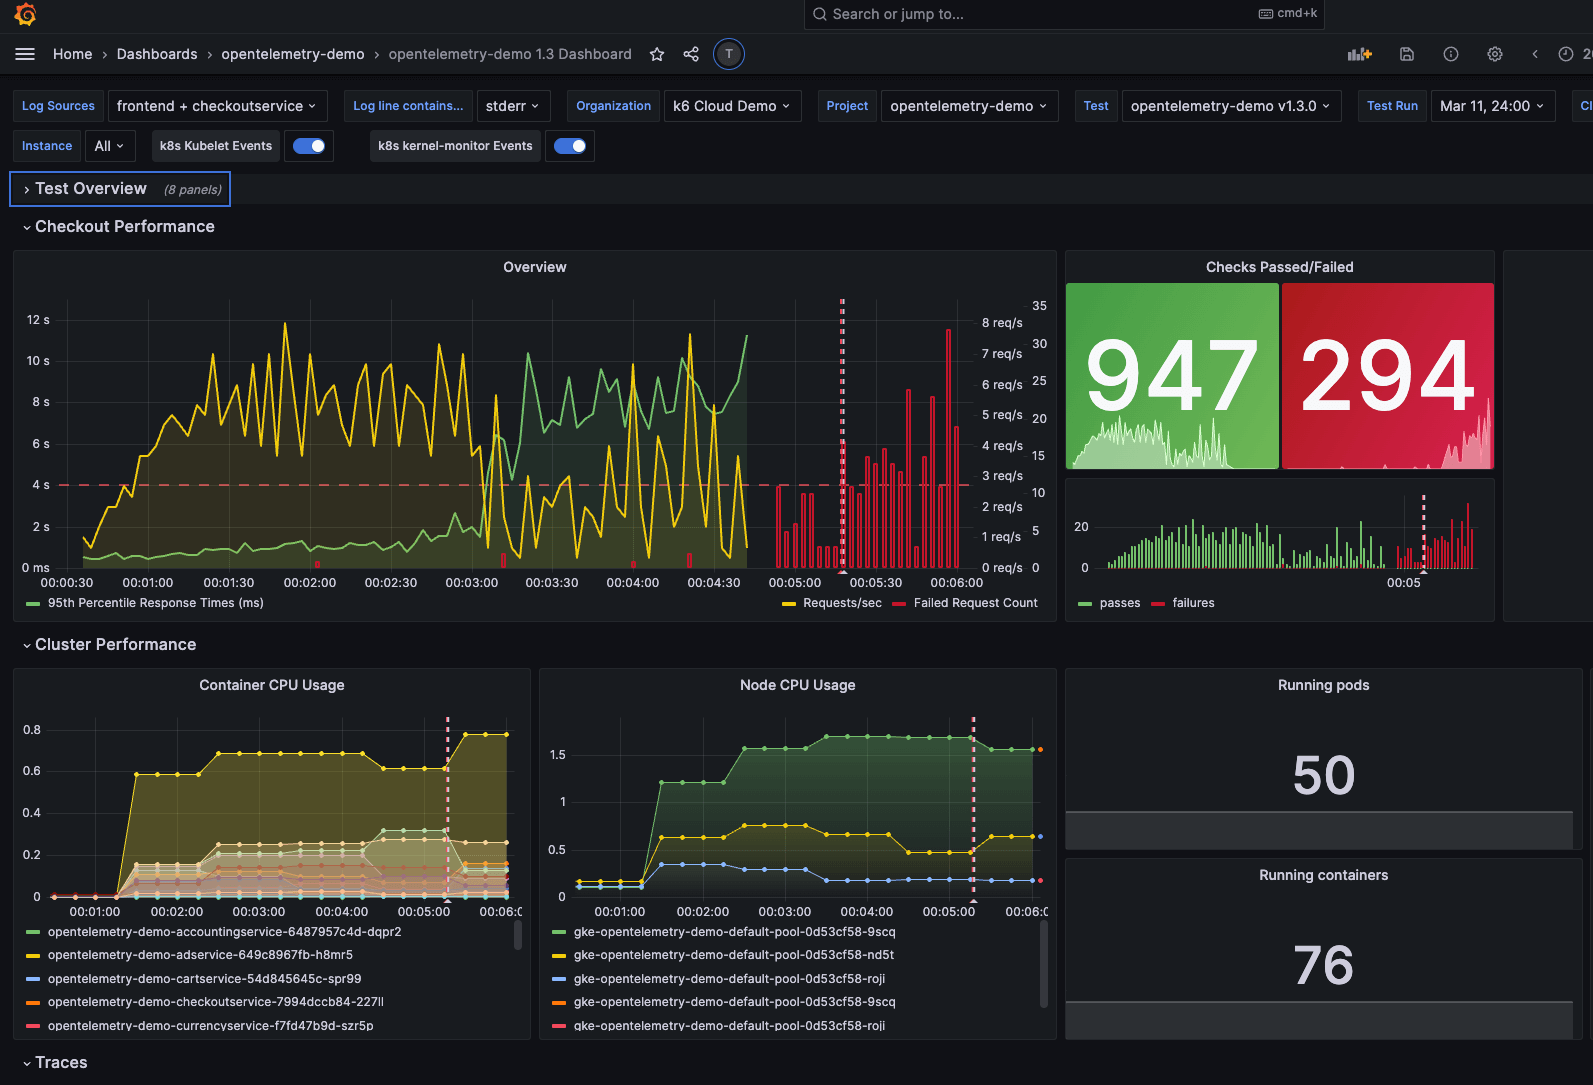
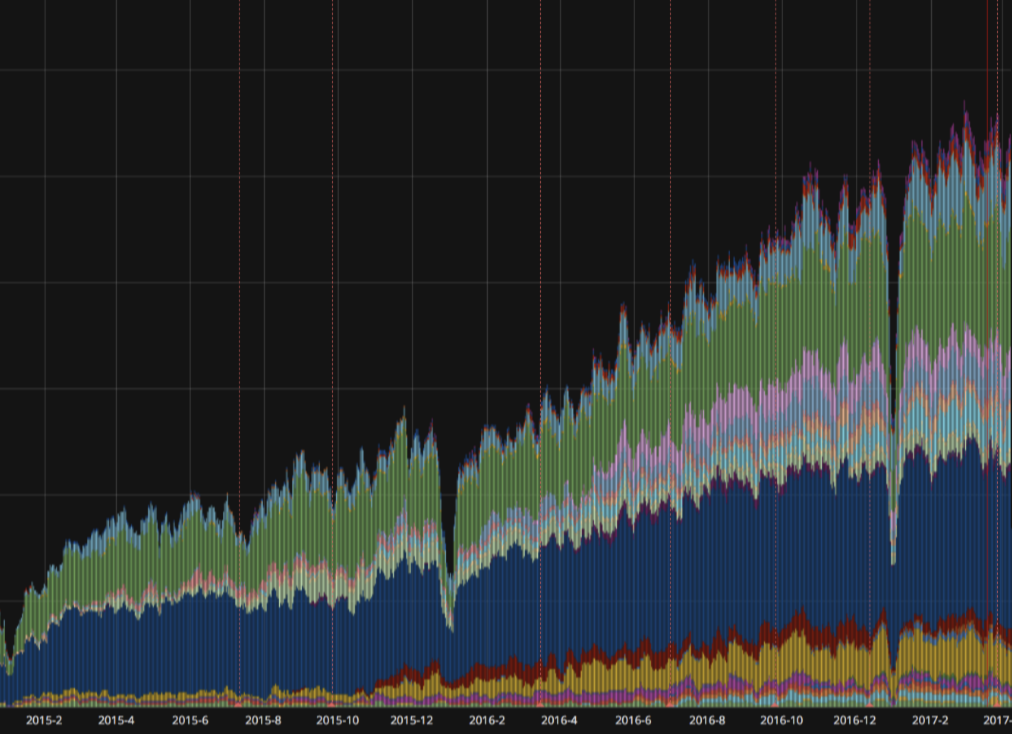
(the screenshot is from https://grafana.com/docs/k6/latest/results-output/grafana-dashboards/</a >)
Challenges in Exporting Code Execution Metrics in a Clustered Environment
Most common metrics, such as order counts of inventory levels, are readily available from the database and can be accessed from any node in the cluster, so there is no any issue with such.
However, certain metrics related to the cluster node state, to the node where code is actually executed present unique challenges to be eventually delivered to Prometheus and Grafana. For simplicity, let’s take “controller execution time,” as an illustration. You can use a Micrometer
Technically, the right way of doing such things is using Dynatrace instead. However, for some rare cases, it is convenient to pull such metrics and combine and visualize them in Prometheus/Grafana.
In a clustered setup, each node may handle different requests and hence have different average execution times for the same controller. For example, if we have a cluster of five nodes, there could be five different execution times for a single controller, one per node. Traditional approaches, such as using a cron job to calculate metrics, will typically activate only on the node where the cron job runs. This setup fails to capture the execution times from other nodes, which are crucial for a comprehensive understanding of system performance.
To accurately monitor metrics like controller execution time across all nodes, we need a strategy that allows for the aggregation of data from across the cluster. Here are two potential approaches:
- Using a centralized storage: One method could involve storing the execution times in a centralized database. However, this approach might lead to performance bottlenecks due to the high frequency of write operations required, especially in a large-scale system with many nodes.
- Cluster-wide Events: A more efficient solution could involve the use of cluster-wide events. When a controller finishes execution, it could emit an event with its execution time. This event would be captured by a dedicated metric calculation cron job running on any node in the cluster. Thus, regardless of which node the cron job executes on, it would have access to the execution times from all nodes. However, this approach may face challenges with high-frequency events, as they can generate significant network traffic, potentially leading to congestion and impacting the overall performance of the system.
Next steps
Prometheus and Grafana are good, but what if you need to get to the next level without redesigning the existing Prometheus+Grafana solution explained above?
Prometheus is well-regarded for its powerful capabilities but does have some known downsides:
- Storage Challenges: While Prometheus handles short-term metric storage well, it is not optimized for long-term data storage. Its local storage is not highly durable, and setting up and maintaining long-term storage solutions can be complex.
- No Built-in Anomaly Detection: Prometheus lacks built-in capabilities for anomaly detection, relying instead on static thresholds for alerts. Users often need to integrate additional tools or employ custom solutions for more advanced analysis.
In its open-source version, Grafana’s finer-grained access controls are limited. Organizations with complex security and access requirements might need to upgrade to Grafana Enterprise for better control.
Thanos
Thanos (https://thanos.io/) is an extension of Prometheus designed to provide a scalable, highly available, and long-term storage solution for Prometheus data. It enhances the capabilities of a basic Prometheus setup in several key ways:
- Global Query View: Thanos allows multiple Prometheus instances to work as a cohesive system, providing a unified view of metrics collected from different Prometheus servers. This is particularly useful for larger systems spread across different regions or data centers.
- Reliable Historical Data Storage: Thanos integrates with various cloud storage solutions (like S3, GCS, Azure Blob Storage) to store historical metric data. This storage is typically more reliable and can handle more data than local disk storage used by Prometheus.
- Unlimited Retention: Because Thanos can offload historical data to cheap, scalable external storage, it enables Prometheus to retain metric data indefinitely. This is a significant improvement over Prometheus’s local storage, which has practical limits on data retention due to disk size constraints.
- Downsampling: Thanos can reduce the resolution of stored data over time (downsampling), which helps in managing storage costs and improving query performance for long-range queries over historical data.
Can we use AI/ML here?
Absolutely!
AI/ML can help predict trends and potential issues before they become problematic. By analyzing historical data, AI models can forecast future behavior and alert teams to potential spikes or drops in data volumes, or other crucial metrics. This anticipation helps in proactive system management.
AI excels at identifying patterns and can therefore detect anomalies that deviate from these patterns. This is crucial for early detection of potential system failures or unexpected behaviors, such as sudden drops in performance metrics or unusual transaction volumes.
Grafana Cloud provides mechanisms for the purpose:
https://grafana.com/docs/grafana-cloud/alerting-and-irm/machine-learning/
Since it is completely compatible with free and easy-to-setup Grafana on-premises, you may decide to upgrade it to the cloud version that provides more capabilities out of the box.
Conclusion
In wrapping up, it’s clear that keeping a close eye on both operational and technical metrics in e-commerce is essential. Our deep dive into creating a tailored solution with Prometheus and Grafana shows just how flexible and powerful these tools are. They’re not just about catching numbers, but really getting a live picture of what’s happening, which is critical for staying on top of things.
Implementing this in SAP Commerce highlights how crucial it is to be thoughtful and strategic. Monitoring everything from data spikes to system stability isn’t just a nice-to-have; it’s a must for keeping things smooth. As businesses grow, the need for dynamic monitoring systems becomes more of a necessity than a luxury.
Looking ahead, the key is to keep evolving and adapting. As new tech comes into play, updating our monitoring strategies will keep businesses strong and responsive, ensuring they don’t just keep up but stay ahead. It’s all about pushing for efficiency and excellence, making sure the company not only runs well but also stands out as a leader.

Comments are closed, but trackbacks and pingbacks are open.