

In this article, I want to talk about my experience with making website and online store search more responsive to business requirements and user expectations.
It’s common to give too much attention to technical issues, especially now, with the advent of machine learning and AI in this field. But more often than not, the deepest problems are on the surface, and their solution is much simpler than a functional refinement.
One of the main challenges in managing e-commerce websites is ensuring that the product search feature works effectively. Imagine this: you notice an issue with how products are being found through search, and you decide to fix it by tweaking some settings. However, altering these settings could unexpectedly impact your business. When we talk about something being “broken,” it’s not just about error messages popping up. Rather, it could mean that customers are having a harder time finding what they want, which might lead to fewer sales over time. This is a subtle effect that can spread across your entire platform. But how do you pinpoint the exact cause of such a decline? Testing and monitoring changes in an e-commerce environment are complex because even small modifications can have wide-ranging effects on customer behavior and, consequently, sales performance.
To monitor changes, it’s essential to understand what to collect and how to extract data from the gathered information. Specifically, for e-commerce search, there are no good ready-made monitoring tools available, but there are various DIY kits that address some needs. Such tools suggest collecting and analyzing search results for reference queries and visualizing changes over time. However, this approach falls short in many respects. For instance, it only covers the most frequent queries.
When it comes to modernizing site search, there’s a big question about whether this is done from scratch or whether it’s possible to use accumulated data from existing sessions. Developing from scratch is always a risk because any assumptions you have about how users will search for content may be wrong. Therefore, regardless of how good the first version of the search turns out to be, it will need to be revised and reworked many times.
Today, I want to share the approach that I have used in several projects. I call it Search Analytics.
Here, we assume that some form of search already exists on the website and is being intensively used by users and customers. If this is not the case, then there’s nothing to analyze yet. You need to implement some initial version first and start collecting statistics right away while simultaneously modifying the solution. Regardless, without sufficient traffic, there’s little benefit to be gained from the statistics. It could take forever to gather enough data that is actually helpful for enhancing search capabilities.
Yet there are plenty of systems where this type of statistical data can be compiled in as little as a week or a month. Those are the systems we’re focusing on. Pick any big e-commerce store with thousands of orders a day, and that will be the case.
So, there are three canonical phases to consider:
- Collecting data
- Processing data
- Generating parameterized reports
So the first thing I started with was data collection. This data can be accumulated in existing analytics systems, but specifically in the two projects where I worked with this topic, the existing analytics systems did not support the required functionality.
I had to come up with a quick makeshift solution in order to obtain the necessary data as soon as possible while simultaneously working on a full-featured data collection module.
In an online store, it was important to collect information about user sessions and their actions during that session, organized by time and linked with each other. For example, a user may search for a product by keywords, find something, then put something in the cart, and eventually order something. Or abandon the checkout, come back to search, add something else, and then abandon the website. You need to understand how the initial search is related to the final order. After all, this will help you understand how users search for what they need. It’s also interesting, for example, how users refine their searches, what keywords they add or remove from a query, what facets they choose, and how deep they go into the search results.
Understanding the actions of a single user on the website isn’t particularly valuable. Rather, it’s crucial to comprehend the behavior of user groups and identify potential issues with the search mechanism or product descriptions by observing anomalies in their collective actions.
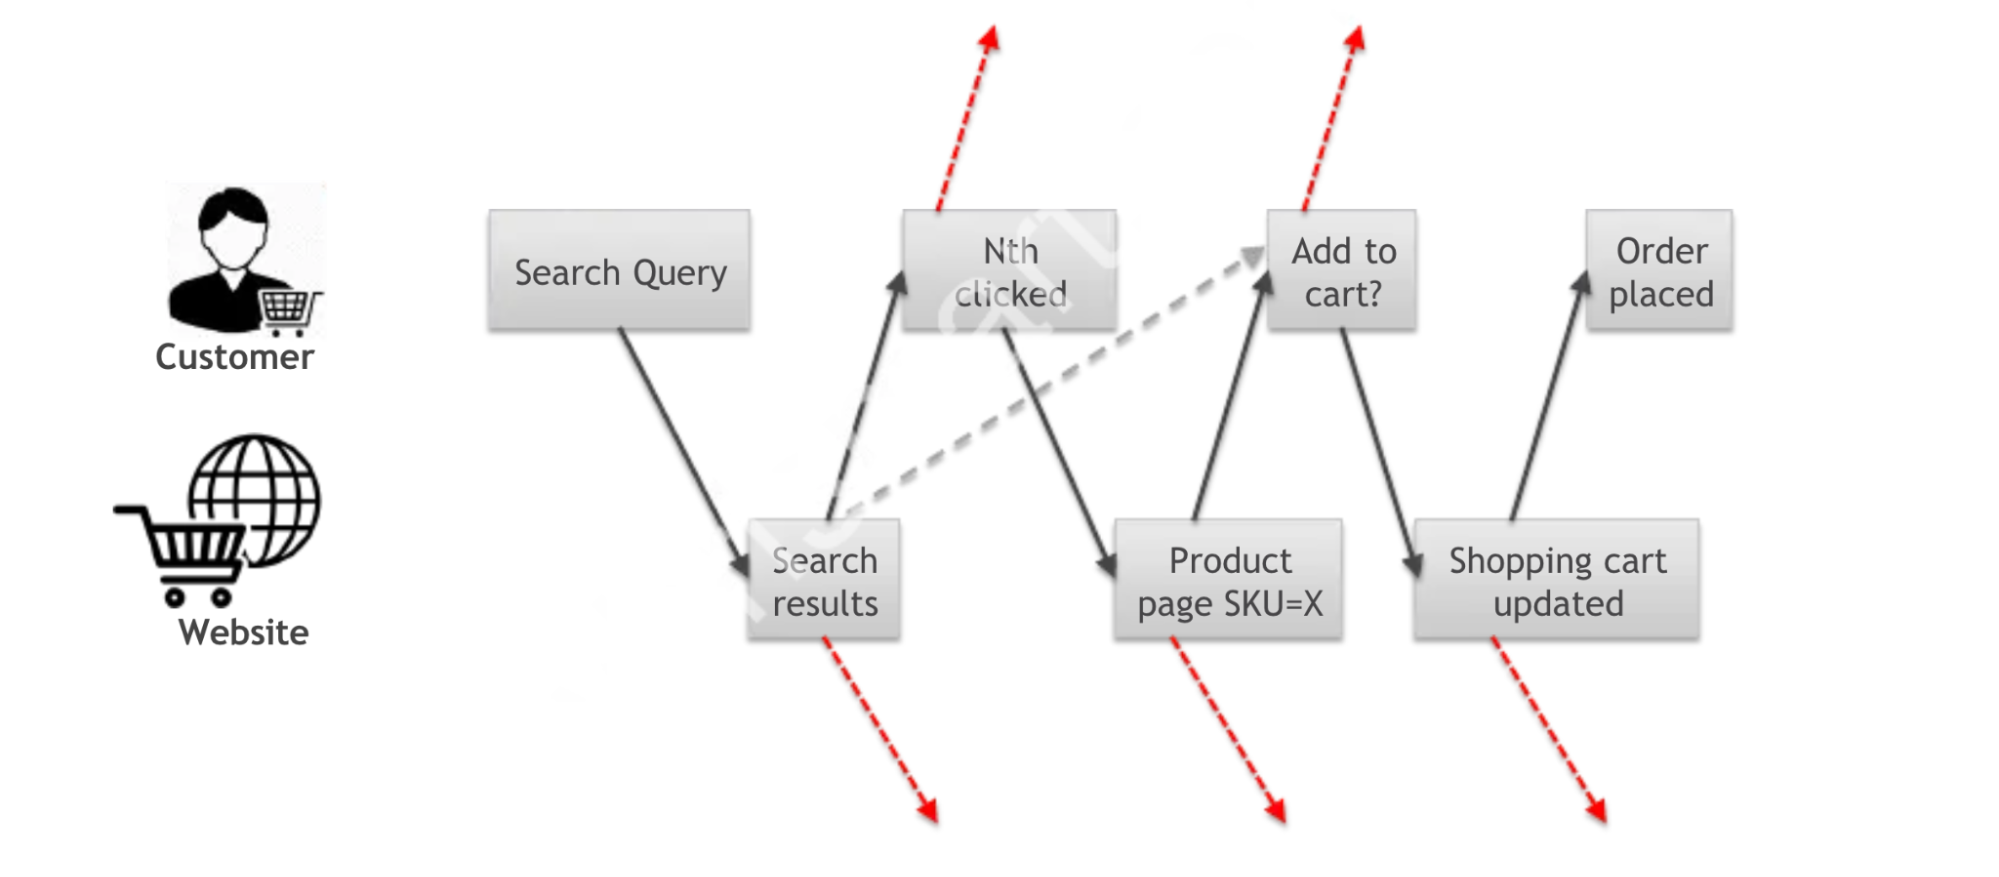
In order for such reports to be compiled in principle, it is necessary to collect information about user actions in a certain format. For an online store, it made sense to collect this from at least four types of pages and actions:
- PLP/SLP – product list page/search results page
- PDP – product details page
- ATC – add-to-cart action/event
- PO – order placed action/event
Here’s what information I gathered for the four types of pages:
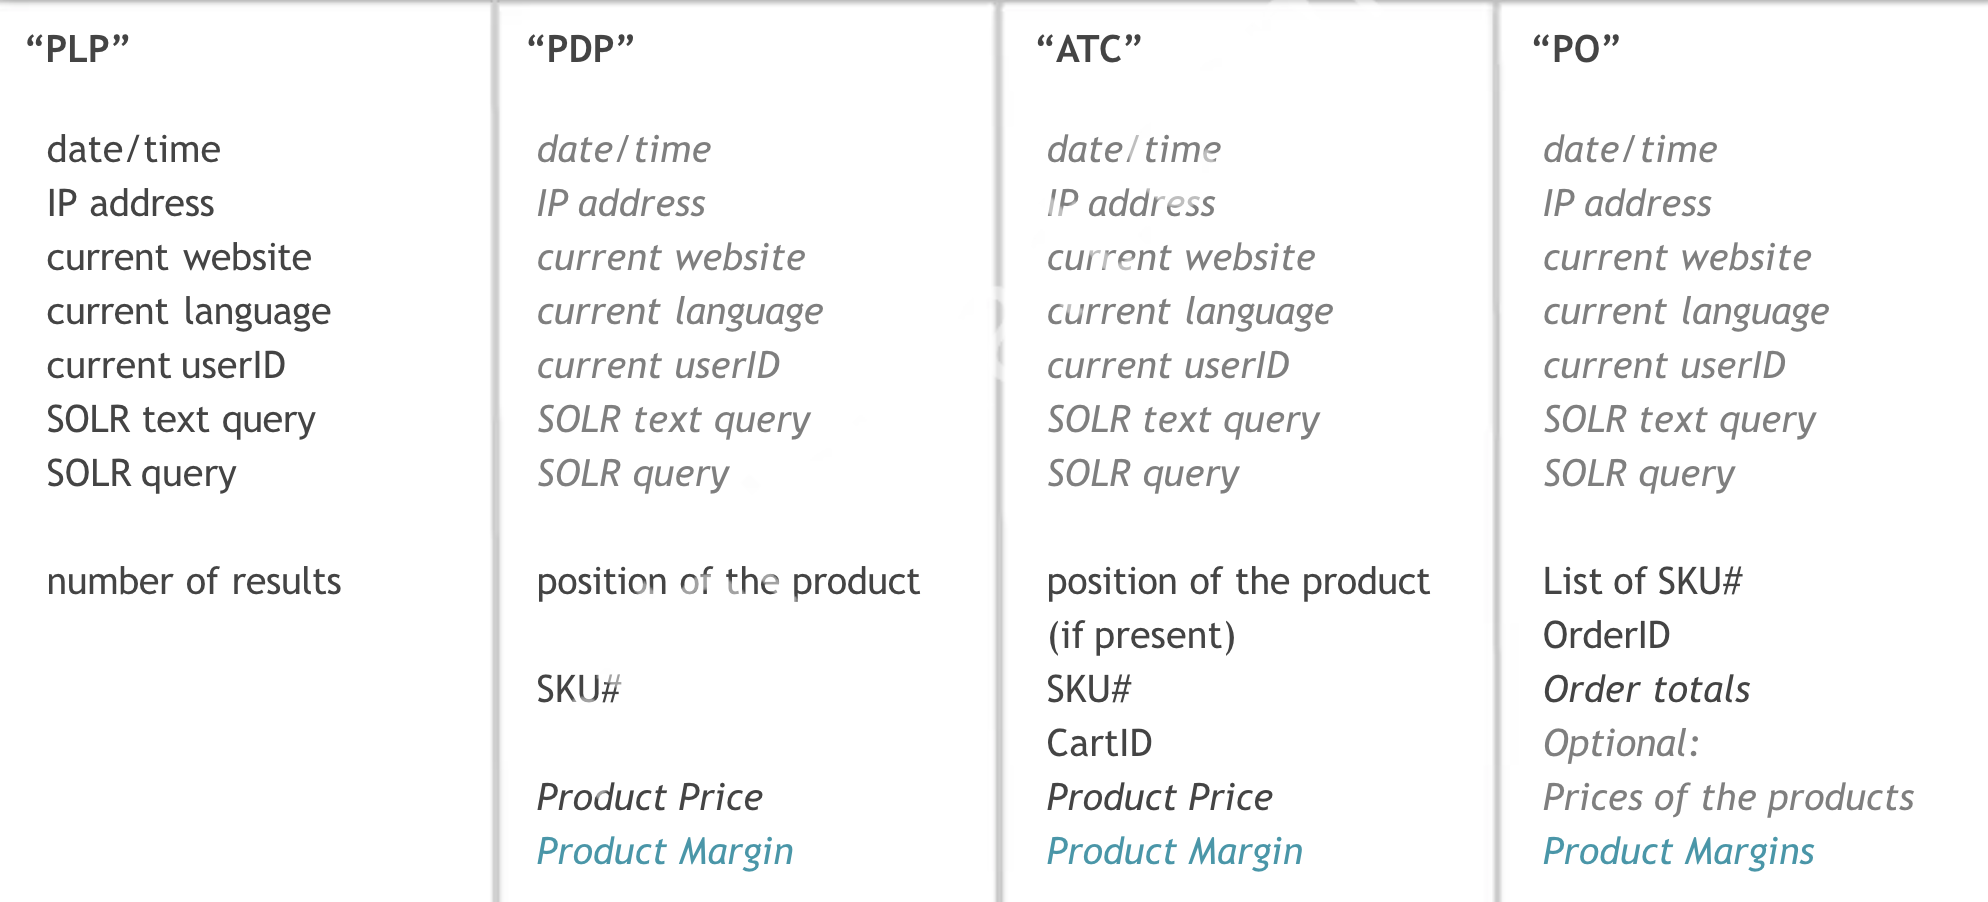
Note that the product position in the search results or the user’s search query is stored in the collected data not only for the search page but also, for example, when clicking Add to Cart on the product page or when an order is placed, where there seems to be no direct connection to the search. Of course, this product page could be accessed directly from Google or, for example, by selecting the product in the catalog. Then the position of the product and the search query will be empty, and in the future, for analytics and reporting, it can be taken into account or not taken into account. But for situations where the product card is opened from the search results, this information is saved. Additionally, we need to store the absolute position of the clicked item in the search results, taking pagination into account.
Actually, this feature makes existing analytics systems insufficiently functional.
There are various technical solutions for such tasks, ranging from simple and trivial to more complex ones. For instance, in one of my projects, I utilized Snowplow. The most basic solution, akin to a duct-tape-and-baling-wire approach, involves hosting a 1×1 pixel GIF on Amazon S3 and extracting query parameters from the access logs. Of course, I’m not suggesting you take that route.
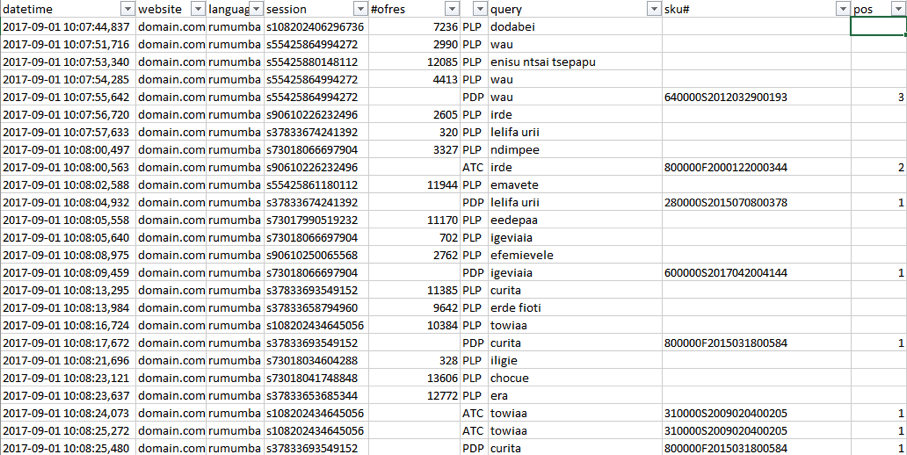
One way or another, over time, you end up accumulating information somewhat like this:
- datetime
- website
- language
- user/session id — represents a user, including anonymous users
- # of search results — if applicable
- type of the page or event/action — PLP/SLP/PDP/ATC/PO; see below
- a user query — if applicable
- a Solr query — optional; it depends on a user query, if applicable
- sku# — if applicable
- position in the search results — if applicable
Next, the most interesting thing is what insights can be extracted from such accumulated statistics.
What is of interest is the nature of one user’s actions during one session. For example, here is how the session of one of the users looked. As we can see, the user searched for the word dodabei and then went to the product page SKU=…013 by clicking on the second link in the search results. Then we see that the user also opened the product card by clicking on the third link. And then searched for another word, etc. In this screenshot, all data is obfuscated because, of course, I can’t show real reports.


From such sessions, we can judge which products users found for which queries and which of these products were purchased or at least put in the cart.
But just as importantly, we can see what products users did not find in the search results, or found but did not follow to the product page and did not add to the cart, despite the fact that the products were in the first positions.
We can understand what products are showing up in search results, but just as importantly, what products are not showing up. OK, when we say “not showing,” it’s not about zero appearances; it’s about low rankings compared to others.
Here, for example, is a report on search keywords. It has several columns:
- Count – number of searches with this keyword
- ATC – number of searches with this keyword followed by at least one Add to Cart from the search results or from the product page to which a user came from the search results
- Order – number of searches with this keyword followed by a placed order with a product from the search results within the same session
- min – the minimum position in the search results that users clicked on for this query
- max – the maximum clicked position, taking pagination into account, of course
- avg – the average of the clicked positions. Of course, the distribution of clicked positions is very uneven, and the average is not the average between max and min.
- ATC/Count is a ratio that shows how often products from the search results are added to a cart for this query.
- Order/Count is a ratio that shows how often products from the search results are ordered for this query.
- #atcratio is an index of the position in the list sorted by ATC/Count in descending order. The lower the number, the higher the “success” of the search query.
- #totalratio is an index of the position in the list sorted by Count in descending order. The lower the number, the higher the frequency of the search query.
- multipl represents the product of #atcratio and #totalratio. It helps to filter out infrequent productive queries from frequent productive queries.
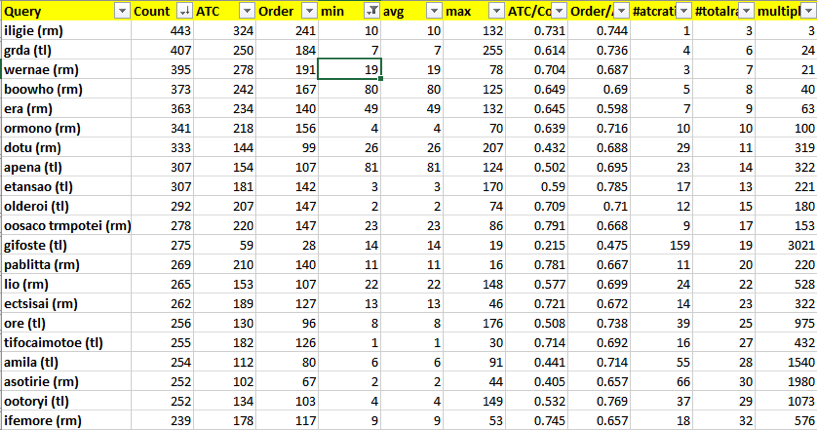
For example, from this report, you can find frequent queries for which many users click on positions on the second or third page of search more often than should be expected on average for some reason. After all, a good search should show what the user is looking for closer to the top of the list. And according to the report, we see that for some queries this is not the case.
This is often a very valuable observation because it tells us about problems in setting up synonyms, stop words, or product descriptions.
This is especially useful for sites that have versions in multiple languages. For example, “bread” in French is “le pain.” Therefore, customers may use the word “pain” when trying to find bread in the catalog. However, even in the French version of the catalog, you may have products with “pain” in the title, such as pain medicine. What did the user mean when they searched for “pain”: painkillers or bread?
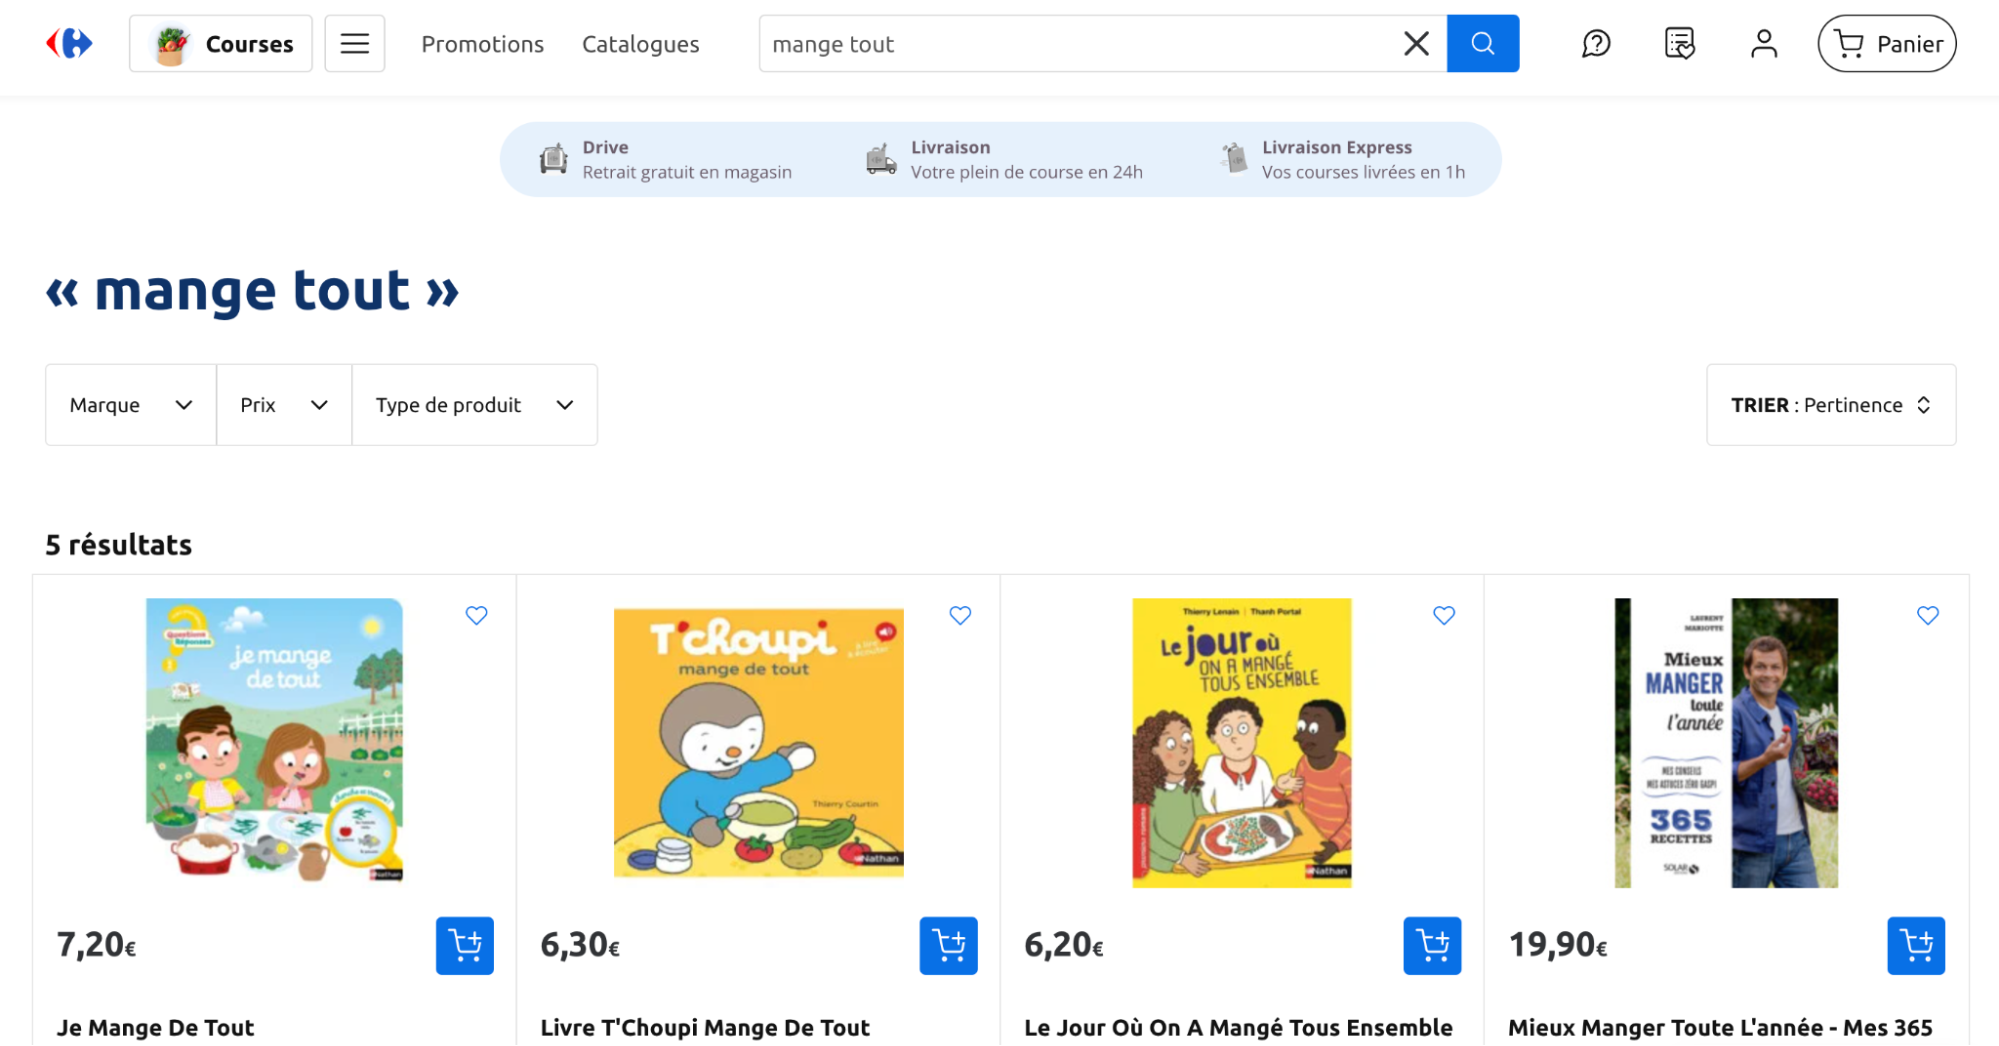
Or another example. In French, “mangetout” refers to a type of pea, specifically the snow pea or sugar snap pea, which is eaten whole, pod and all. The term translates to “eat all” in English, indicating that the entire pod is edible and does not require shelling. Many customers spell it as “mange tout” — a phrase containing two common words, “eat” and “all.”

Reports based on the analysis of user behavior showed, for example, that people were still buying bread for the word “pain,” despite the fact that it was on the third page of search results. And there were quite a lot of such users for this feature to be noticeable in the statistics.
For the most frequent queries bringing sales and traffic, it is important to track what is included in the first 10–20 search positions and detect or highlight all abnormalities. Such abnormalities happen if the catalog is filled with products that have words in the description and title that change the search index so that customers can no longer see the products they need for their usual queries. That is, you have added 200 products in some not very important category, and your sales are falling. Why? Because customers used to see some product in the first positions for frequent queries, but now they no longer do.
Therefore, it is very important that any changes in the search configuration and any manipulations with the catalog be accompanied by search reports. In many ways, automation can highlight changes that can affect the business.
By processing thousands of user sessions, we can collect the keywords that users used to find products and associate these keywords with the products.
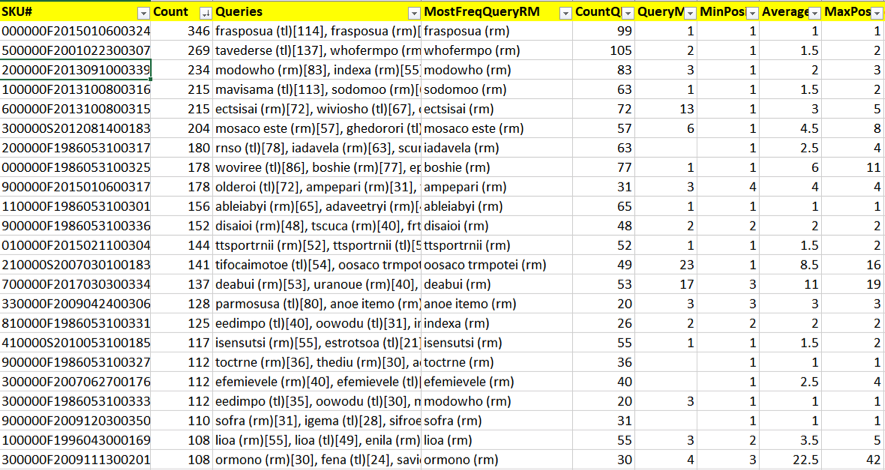
In the first column, you see an SKU. The second column, “Count,” shows how often a product is clicked by customers in the search results and how often a product page was displayed. The CountQ column contains the total number of keywords. The keywords themselves are grouped in the Queries column and sorted by frequency.
There are three useful columns: MinPos, Average, and MaxPos. They show the product positions for the most frequent query. We can see that most of the time the minimum position is 1 or 2, which is logical: users click on the first search results and find this product. But for some products, this number may not be small. If this is not due to the scarcity of statistics, which means we need to accumulate more data, then it can be explained by the fact that this product is simply difficult to find in search. Or maybe it can be found only by some keywords that are very rarely used by real customers. The same group includes items that are not on this list at all.
Based on the collected data, one can build a report: “Frequent queries with zero or low ATC.” These are queries for which, for some reason, almost no one or no one adds products from the search results to a cart. Often, this indicates that the search is producing zero results or non-zero results that are something completely absurd. It is important that you can separate these two categories easily because the number of search results is stored in the collected data as well.
When I gave such reports to client managers, we often didn’t understand why there were no “sales” for some queries. For example, one of the major cosmetics brands was searched for 40 times a day by different users, and there were no add-to-carts at all. It can be assumed, for example, that the price for such products, which is displayed right in the search results, was too high, or a specific product of such a brand was advertised on television, did not appear in the list, and customers abandoned the search.
There is also an interesting report: “Abandoned searches.” It refers to the situation when a user searched for something and got some results — this is important: the results were there — but then did not click on anything. We are not interested in one user in particular, but in queries from this category sorted by frequency. Unlike zero-result searches, which are collected by many people, this category contains queries for which the results are not zero, but which have a zero or very low percentage of clicks to the product card, or add-to-cart actions directly from the search results.

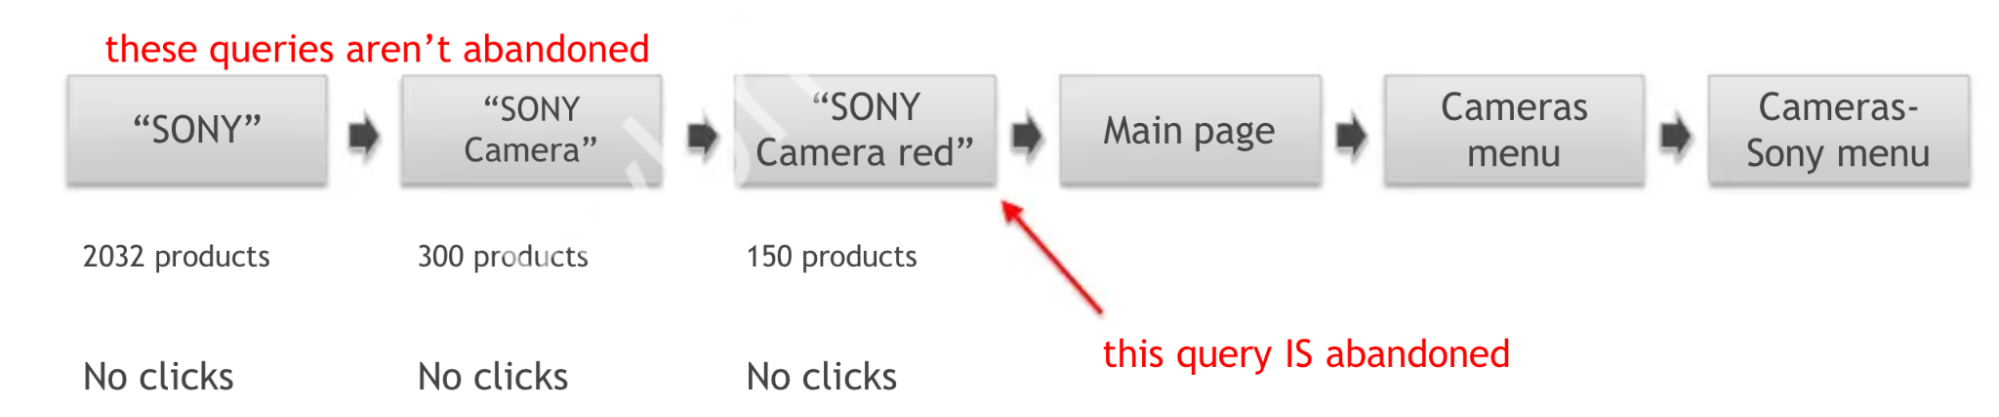
It is important to distinguish between abandoned queries and refinement of a search query. For example, the user realized that the word SONY gives too many results, mostly non-relevant, and then added the word camera, then added red, and then went to the main page and found cameras through the navigation. The presence of a large number of such cases may indicate that something is wrong with the search and give reasons to test these cases more carefully.
The above is basic functionality that is relatively easy to implement and deploy on any big e-commerce website. There is a more complex mechanism in development, where patterns of user behavior such as “went to the product page from the search results and then clicked on add to cart, and then eventually bought the product” can be described in the form of formal rules that define the session, and the data collected in this way can be visualized in the form of regular reports. In this version, recognizing patterns and linking actions in a chain happens in real time. It helps generate a report for millions of events in seconds.
Maybe, someday, the mechanism described above will emerge as an off-the-shelf product. For now, it is a set of practices and developments that are adapted for each specific case with direct involvement of biological brains. Among the advantages of this approach is the almost complete absence of limitations, and using previous experience allows one to avoid pitfalls and move toward the goal confidently and predictably.