

This article is brought by
In the previous part, we discussed the importance of redundancy and failover in a cluster setup and introduced JGroups as a crucial component of SAP Commerce Cloud for distributed messaging and eventing. In this part, we will delve deeper into troubleshooting common issues that arise with JGroups in SAP Commerce.
In this article, we will explore troubleshooting tips for common issues related to JGroups in SAP Commerce. We will discuss how to address data inconsistencies, handle dynamic IPs and membership discovery, and effectively monitor the cluster.
It is important to highlight that these recommendations were formulated and tested for the on-premise, self-hosted SAP Commerce. This setup is now rare, as many SAP Commerce projects have already been migrated to the cloud. In the cloud setup, such challenges may never be your concern, as they fall under the responsibility of SAP CCV2 support engineers. However, understanding the limitations and constraints will still help you build the solution correctly.
As an example of good advice on the topic: minimize the volume and number of Cluster Aware events flowing in and out. A system with an excessive amount of these events and messages is more prone to instability, especially in the cluster where JGroups is configured to work in the TCP mode. Also, try to keep events lightweight and only store the minimal amount of information. Let’s delve deeper into this matter.
A bit of theory behind JGroups (“refresher”)
In the first part, we explained the differences between TCP and UDP modes for communication between cluster nodes.
UDP mode, using IP multicast, is often preferred for large clusters as it enables efficient point-to-multipoint communication. However, not all infrastructures support UDP multicast, such as Amazon Elastic Compute Cloud (AmazonAmazon EC2). In such cases, you may need to use UDP without IP multicast or switch to TCP mode with point-to-point connections.
If you’re already familiar with JGroups, feel free to skip this introductory section and jump straight to the part where we delve into solving a specific problem. However, if you’re new to JGroups or need a refresher, I recommend reading on to understand the underlying theory behind it.
JGroups is a Java library that enables communication and coordination among themultiple apps or instances of thean apps in the cluster. It allows you to form dynamic clusters, exchange messages, and manage group membership. It provides reliable and ordered message delivery one-to-one and one-to-many, unicast and multicast communication. Additionally it provides/supports various protocols for failure detection and recovery.
Here are a few examples of how JGroups can be used:
- Messaging Hub (pub/sub): JGroups can be used to build a basic messaging system where messages are broadcasted to multiple recipients in a cluster. It ensures reliable delivery of messages and provides features like ordering, concurrency control, and message filtering. In SAP Commerce, this feature is used to distribute cluster-aware events. It comes to play when there is some need to propagate some information across the cluster and activate listeners on each node.
- Distributed Caching: JGroups can be utilized to implement a distributed cache, where data is stored across multiple nodes in a cluster. It enables efficient data replication, synchronization, and consistency maintenance among cache instances. In SAP Commerce, JGroups is used for coordinating the distributed cache across multiple nodes in a cluster.
- Replicated State Machine.
Specifically, it is used to propagate cache invalidation events across the cluster. It comes to play when any modification of any SAP Commerce Objectentity occurs. To avoid cache-related consistency issues, all nodes should reset their caches for this objectentity, and JGroups is used for this purpose. By resetting the caches on all nodes, the system ensures that all subsequentany requestssubsequent fetch for the modified objectentity will retrieveget the most up-to-date and consistent data from the shared shared database.
At its core, JGroups is primarily built on the idea of IP multicast, which enables sending a single message to a group of recipients simultaneously. This multicast communication model helps in efficiently distributing messages across the group members without having to send separate messages to each member individually. While IP multicast is efficient for sending messages to multiple recipients simultaneously, it may not be available or supported in all network environments. For such cases, JGroups establishes point-to-point connections between individual nodes of the cluster. Each node maintains a TCP connection with every other node, enabling direct message exchange. This approach ensures reliable message delivery and ordering but may not scale as efficiently as IP multicast in large groups.
When a JGroups application (such as SAP Commerce Platform) starts, theeach node attempts to join athe group. If it succeeds, the launched app at instance becomes part of the group’s membership. Each member in the group maintains this membership list, and it gets updated whenever a new node joins or an existing node leaves the group. Otherwise, a new group is created. Having multiple independent groups within a cluster where only one group is intended to be active is referred to as a “split brain” situation.
Now, let’s talk about message communication within the group. When a node wants to send a message to the group, it can simply invoke a send() method provided by JGroups. The send() method takes the message as its input and broadcasts it to all members in the group.
Under the hood, JGroups uses so-called protocols to handle various aspects of group communication. These protocols are organized in a stack-like structure called a protocol stack. Each protocol in the stack performs a specific function, such as message fragmentation, reliability, messages ordering, or membership management.
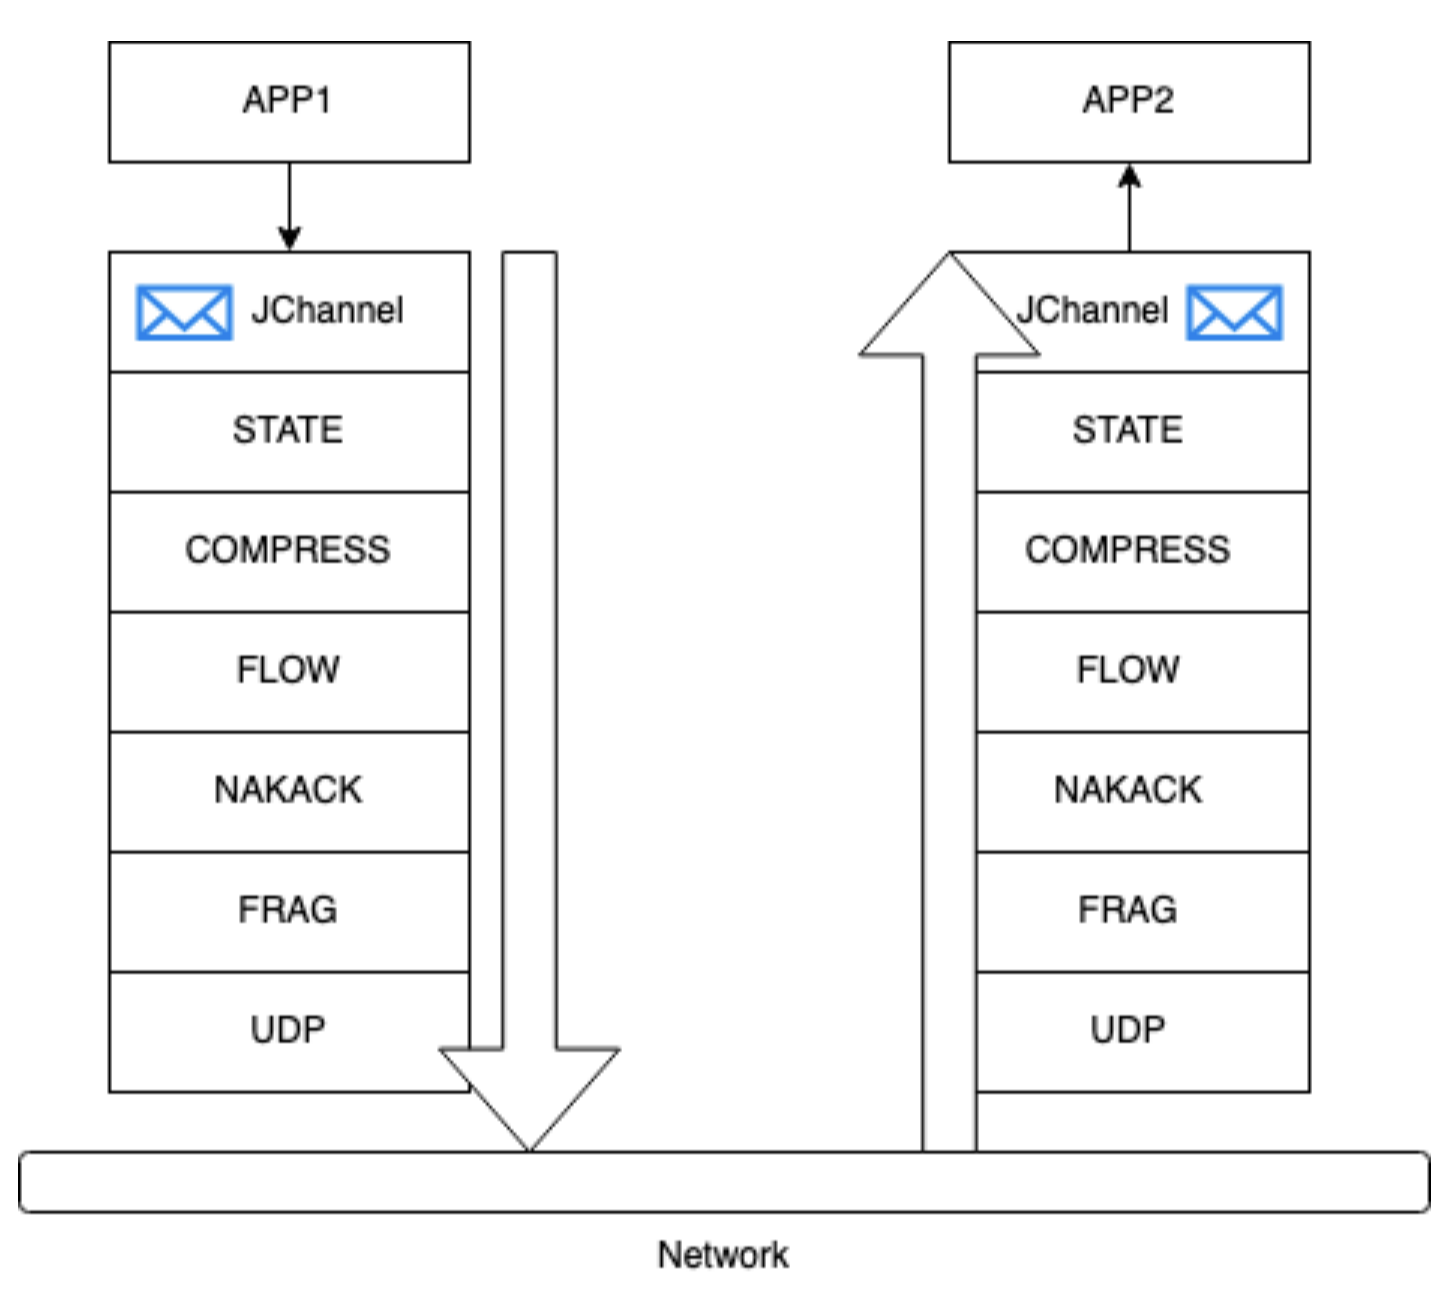
For example, there i’s a protocol (NAKACK2, “Negative Acknowledgement”) responsible for ensuring reliable delivery of messages. It achieves this by adding sequence numbers to messages, detecting missing messages, and requesting retransmissions if necessary. Another protocol, GMS (Group Membership Protocol), handles membership changes, updating the membership list and notifying other members when a new node joins or leaves the group.
The protocols in the stack work together to provide the desired communication guarantees and functionality required by the application. They exchange messages and control information among themselves to coordinate the group communication operations.
Here are some of the commonly used protocols in JGroups along with brief descriptions:
- Transport protocols define how data is transmitted across athe network,. providing the There are two supported underlying mechanisms for reliable and efficient communicationtransmitting data:
- UDP for multicasting (broadcasting, one-to-many),
- TCP for unicasting (point-to-point, one-to-one)
- Discovery protocols define how nodes or components within a distributed system discover and join each other.
- TCPPING: A discovery protocol that uses TCP to form initial clusters by exchanging member information.
- MPING: A discovery protocol that uses multicast messages to detect and join existing clusters.
- Failure Detection protocols define how the liveness or availability of nodes is monitored and detected:
- FD: Failure Detection protocol that monitors the liveness of immediate neighbors in the cluster. it relies on the receipt of regular messages from other members to determine their liveness. When a member receives a message from another member, it resets a timer associated with that member. If the timer expires without receiving any messages from that member, the node with the timer is considered faulty. If the timer expires without receiving any messages from that member, it is considered faulty.
- FD_ALL: expands the scope of failure detection beyond immediate neighbors. Periodically sends heartbeat messages to all cluster members and expects to receive acknowledgments in return. If a member fails to respond within a certain timeout period, it is considered faulty and marked as such.
- Merginge** protocol**s define how separate clusters or groups of nodes can discover each other and merge to form a single cohesive cluster.
- (MERGE3) is needed to heal “broken” clusters. A lot of times all of the application’s nodes will start simultaneously. And just by chance, some of them will form their own clusters, just because they haven’t found one during the startup. Merge protocol checks for other local groups of nodes and merges them back into a single cluster.MERGE3: A merge protocol that handles the merging of separate clusters into a single cluster when they discover each other.
- Reliable Transmission Ordering
- NAKACK2: Negative Acknowledgement protocol that ensures reliable message transmission by retransmitting lost messages.
- UNICAST3: Protocol for reliable unicast message delivery between individual members.
- STABLE: Works in conjunction with the NAKACK2 (Negative Acknowledgement) protocol to guarantee the ordered delivery of messages in the cluster. It maintains a history of sent messages and their corresponding sequence numbers. When a member receives a message, it sends an acknowledgment (ACK) to the sender. The sender, upon receiving ACKs from a majority of the cluster members, considers the message stable and removes it from its history.
- Flow Control protocols define mechanisms and strategies for managing the rate of data transmission between sender and receiver:
- UFC. The UFC protocol in JGroups employs a mechanism similar to that of TCP to address the issue when a sender overwhelms the receiver with an excessive number of messages. In such cases, the receiver can ping the sender, essentially requesting them to slow down the message rate because the receiver is unable to handle the high volume of messages. The UFC protocol helps in managing this situation by facilitating communication between the sender and receiver to regulate the message flow and prevent overwhelming the receiver.
- Basic UFC: Simple flow control protocol based on a credit system. Each sender has a number of credits (bytes to send). When the credits have been exhausted, the sender blocks. Each receiver also keeps track of how many credits it has received from a sender. When credits for a sender fall below a threshold, the receiver sends more credits to the sender. Works for both unicast and multicast messages.
- UFC. The UFC protocol in JGroups employs a mechanism similar to that of TCP to address the issue when a sender overwhelms the receiver with an excessive number of messages. In such cases, the receiver can ping the sender, essentially requesting them to slow down the message rate because the receiver is unable to handle the high volume of messages. The UFC protocol helps in managing this situation by facilitating communication between the sender and receiver to regulate the message flow and prevent overwhelming the receiver.
- Fragmentation:
- FRAG2: Fragmentation protocol that splits large messages into smaller fragments for efficient transmission and assembles them back.
- RSVP is for achieving virtual synchrony guarantees in the presence of message reordering.
Context
Our solution is based on SAP Commerce platform v.1811 and is deployed onwith Amazon Elastic Kubernetes Service (Amazon EKS). We have multiple nodes allocated for different “aspects” — admin, backoffice, background jobs, and integration. This results in a total node count of approximately a dozen.
Problem
What we have noticed is that occasionally certain nodes may become stuck without any clear explanation. This occurrence was infrequent and hard to reproduce, which posed a challenge in diagnosing and resolving the issue.
Solution(s)
Cleaning up cluster state at the startup
The initial step we took was to clean up the JGROUPS_PING and CLNodeInfos tables prior to starting the cluster.
The issue with non-Stateful Sets K8S clusters (such as ours) is that each time the pods are started, they are assigned a new IP address and may be directed to a random node. If there are outdated records in the tables, the GMS will bypass the completefull discovery process and will attempt to use the existing data instead, which is inherently obsolete. By clearing the tables, the GMS protocol will consistently execute the full discovery process upon cluster initialization.
Activating startup cluster ping
If the configuration parameter “cluster.ping.load.on.startup” is set to true, SAP Commerce will initiate a ping handler immediately after the tenant is up. The frequency of the ping is determined by the value set for “cluster.ping.interval” (default is 30). Each node sends a <PING> message to other nodes and handles the response. In the case of TCP setup, it directly contacts the other nodes to send the <PING> message. Essentially, this mechanism serves as a cluster test.
Although we have not extensively researched its effect on actual performance, enabling this setting guarantees that the Hybris internal broadcast mechanism will send notifications to all discovered nodes upon startup. Essentially, this feature enables you to view the entire cluster in the Monitoring->Cluster section of HAC, serving as a useful indicator of proper functionality and interconnectivity among nodes.
Upgrading JGroups library to v4.2.22
It adds new config parameters (like num_discovery_runs), and fixes a lot of small annoying bugs (e.g. not being able to set the debug logging for GMS protocol).
Also we found it to be generally more stable than the version 4.0.24 that comes with vanilla SAP Commerce 1808.
To fix our problem, we made changes in four protocol settings:
- TCP
- JDBC_PING
- GMS
- MFC
Our tests showed that some of the changes from the below had fixed the problem. However, while not directly related to resolving the issues, we discovered certain changes that we believe contribute positively to enhancing overall stability, not fixing the problem. Due to the complex nature of the changes, here we are not separating these two types of configuration changes in this article, the changes associated with resolving issues and the changes associated with enhancing overall reliability. What we observed was that our cluster began to function consistently and predictably, and the problems had disappeared after the changes.
TCP_NIO2:
TCP_NIO2 is a protocol using TCP/IP to send and receive messages. Contrary to TCP (without NIO2 at the end), TCP_NIO2 employs non-blocking I/O (NIO) to avoid the thread per connection approach. Instead, it uses a single selector to efficiently manage incoming messages and delegates their processing to a configurable thread pool.
JDBC_PING:
num_discovery_runs=”3″
Setting “num_discovery_runs” to a value greater than 1 means that JGroups will perform multiple discovery runs in an attempt to establish connections with other nodes. This can be useful in scenarios where nodes might take some time to join the cluster or when there are transient network issues causing connectivity problems during the initial setup. We chose to set it to 3 to handle the scenario where all nodes start simultaneously, rather than one by one. This way, even if some nodes are not yet ready and do not respond during the initial connection setup, multiple discovery runs increase the chances of successful connections as the cluster forms.
GMS config:
<pbcast.GMS print_local_addr=”true” join_timeout=”3000″ view_bundling=”true” max_join_attempts=”1″ level=”debug” />
GMS (Group Membership Service) is a protocol responsible for managing the membership of nodes in a cluster. It handles node joining, leaving, and detecting failures, ensuring that the cluster maintains a stable and up-to-date view of its members.
print_local_addr=”true”. It indicates that the local address (IP address and port) of each node will be printed to the console or log. It helps in identifying which node is running with what address during debugging or monitoring.- This setting was coming with vanilla SAP Commerce, and it was set to
true.
- This setting was coming with vanilla SAP Commerce, and it was set to
join_timeout=”3000″: This attribute sets the timeout (in milliseconds) for the join process. When a node wants to join the cluster, it sends a join request, and if it doesn’t receive a response from an existing member within the specified timeout, it may retry the join process or take appropriate action. In this case, the timeout is set to 3000 milliseconds (3 seconds).- This setting was coming with vanilla SAP Commerce, and it was set to
3000.
- This setting was coming with vanilla SAP Commerce, and it was set to
- view_bundling=”true”: View bundling is an optimization technique in JGroups where multiple view updates (changes in the cluster membership) are bundled together before broadcasting to the members. Enabling this attribute with a value of “true” allows the GMS protocol to bundle multiple view changes into a single message, reducing the overhead of frequent individual view updates.
- This setting was coming with vanilla SAP Commerce, and it was set to
truefor the JGroups TCP configuration.
- This setting was coming with vanilla SAP Commerce, and it was set to
- max_join_attempts=”1″: This attribute sets the maximum number of join attempts that a node will make if it fails to join the cluster during the initial join process. In this case, it is set to 1, which means the node will only attempt to join the cluster once. The default value is 10.
- This is what we changed. We don’t need multiple attempts: it just slows down the startup. If we weren’t able to initialize a cluster or local group in 3 seconds (join_timeout), probably something’s gone wrong. And we still have a MERGE3 protocol that’ll take care of a cluster broken into subgroups.
- level=”debug”: This attribute sets the log level for the GMS protocol to “debug”. In debug mode, the GMS protocol will produce more detailed log messages, which can be helpful for debugging and troubleshooting.
- This is what we added for the lower environments for better troubleshooting. For the production cluster, it is not required.
MFC config:
<MFC max_credits=”20M” min_threshold=”1.0″/>
MFC (Message Flow Control) in JGroups is a protocol responsible for regulating the flow of messages within a cluster, preventing overload by managing message credits and ensuring efficient communication. It controls the number of messages a receiver can buffer before acknowledging receipt to the sender, maintaining stability and preventing overwhelming receivers with excessive messages. There are credits, which are used as a form of “currency” to control the flow of messages between sender and receiver nodes. Each receiver is allocated a certain number of credits, which represents its capacity to buffer incoming messages before acknowledging their receipt.
- **max_credits=”20M”.**This attribute sets the maximum number of message credits that a member can accumulate. In the context of Message Flow Control, message credits represent the capacity of a receiver to buffer incoming messages before acknowledging their receipt to the sender. In this case, the max_credits is set to “20M,” which means 20 million credits.
- This setting was coming with vanilla SAP Commerce, and it was set to
20Mfor the JGroups TCP configuration out of the box.
- This setting was coming with vanilla SAP Commerce, and it was set to
- min_threshold=”1.0″. This attribute sets the minimum threshold (%: 0-1) for triggering the replenishment of message credits. When the available credits fall below this threshold, the receiver will request more credits from the sender. The default value is 0.5 (50%), the value recommended by SAP was 0.6 (60%).
- This is what we changed. We set it to 1 (100%). The value of “1.0” in this case indicates that the replenishment will be requested when the remaining credits are exhausted (i.e., 0 credits remaining).
By the way, there are two MFC mechanisms, blocking (MFC) and non-blocking (MFC_NB). We do not use the non-blocking version because the queue mechanism is buggy in v4.*. If the queue is full, it’ll never clean up itself, even if you stop sending requests. It may clean up itself with min_threshold set to 1.0, but it still takes a lot of time. Increasing the queue size just delays the problem rather than solving it.
The blocking version (MFC) seems to be working far more stable, and since there’s no queue, it cannot be stuck. If the load profile is such that you usually get low amount of messages, and periodic bursts of traffic – you should increase min_threshold and make it closer to 1.0, or set to exactly 1.0 as we did. This parameter basically sets the “amount of flow control” from the recipient side. The closer the value to zero, the rarer senders receive new credits. With the value set to 1.0, the recipient will always provide the sender with new credits. And since the sender is blocked while waiting for the new credits – the time it takes to receive new credits will act as a flow control itself.
Note that with the threshold set to 1.0 you don’t really get a lot of flow control, and you risk overloading the receiver. However, in our case, we were getting a lot more problems with the flow control mechanism blocking everything, and never had issues with SAP Commerce not being able to process the load. It might be different in your case, so we would suggest starting with a high threshold value (like 0.8) and trying out your load. Only increase it if you have issues with this value.
Also consider experimenting with the max_credits param. It specifies the amount of credits (bytes) a node can send to another node before it has to ask for new credits. So the value 20M means your nodes get approximately 20MB of data cap to spend on messages. When a node hits the 20M limit, it asks the recipient for the new credits. In the blocking version of the protocol the node blocks until it receives the credits. In the non-blocking version, it puts the message into the queue and then requesting new credits – hence the “non-blocking”. However, if the queue gets full, the node blocks. And what’s important – when the queue gets full, the node won’t ask for new credits. So if for some reason the recipients are so busy they don’t respond with new credits, your node will be stuck almost indefinitely.
A nodes receive only enough credits to send the message it wants to send.
Full config after these changes:
<config xmlns="urn:org:jgroups"

xmlns:xsi="http://www.w3.org/2001/XMLSchema-instance"

xsi:schemaLocation="urn:org:jgroups http://www.jgroups.org/schema/jgroups.xsd">


    <TCP_NIO2
            recv_buf_size="${tcp.recv_buf_size:20M}"
            send_buf_size="${tcp.send_buf_size:2M}"
            max_bundle_size="64K"
            sock_conn_timeout="60"
            thread_pool.enabled="true"
            thread_pool.min_threads="10"
            thread_pool.max_threads="100"
            thread_pool.keep_alive_time="5000"
            bind_addr="${hybris.jgroups.bind_addr}"
            bind_port="${hybris.jgroups.bind_port}"
            logical_addr_cache_max_size="500"
    />

    <JDBC_PING connection_driver="${hybris.database.driver}"
               connection_password="${hybris.database.password}"
               connection_username="${hybris.database.user}"
               connection_url="${hybris.database.url}"
               initialize_sql="${hybris.jgroups.schema}"
               datasource_jndi_name="${hybris.datasource.jndi.name}"
               remove_all_data_on_view_change="true"
               write_data_on_find="true"
               num_discovery_runs="3"
    />

    <MERGE3 min_interval="10000" max_interval="30000" />
    <FD_SOCK />
    <FD timeout="6000" max_tries="3" />
    <VERIFY_SUSPECT timeout="3000" />
    <BARRIER />
    <pbcast.NAKACK2 use_mcast_xmit="false" discard_delivered_msgs="true" />
    <UNICAST3 />
    <pbcast.STABLE stability_delay="1000" desired_avg_gossip="50000" max_bytes="4M" />
    <pbcast.GMS print_local_addr="true" join_timeout="3000" view_bundling="true" max_join_attempts="1" level="debug" />
    <MFC max_credits="20M" min_threshold="1.0"/>
    <FRAG2 frag_size="60K" />
    <pbcast.STATE_TRANSFER />
</config>
After applying the changes the issues had gone.
However, we recommend educating the development team about how the cluster aware messages are handled under the hood. Excessive use of the cluster aware messages promises complex issues hard to diagnose and fix especially when you cluster grows and especially if you use JGroups in the TCP mode.
Discussion
Powered by GitHub Discussions — sign in with a GitHub account to join the conversation.